CAVA Group, Inc. delivered one of the strongest Q1 prints in the restaurant sector, but with the stock up more than 100% from its lows, the real question is howCAVA Group, Inc. delivered one of the strongest Q1 prints in the restaurant sector, but with the stock up more than 100% from its lows, the real question is how

CAVA Just Delivered 32% Revenue Growth While Most of Fast Casual Is Struggling

2026/06/16 04:28
7 min read
For feedback or concerns regarding this content, please contact us at crypto.news@mexc.com

Key Stats for CAVA Group Stock

  • 52-Week Range: $43.41 – $98.79
  • Current Price: $90.99
  • Street Mean Target: $92.00
  • Street High Target: $110.00
  • TIKR Annualized IRR (Mid): ~20% / year

Fast casual has had a rough stretch, as traffic across most major chains has been flat to negative, consumers have grown more selective, and a handful of well-known names have leaned on discounting just to hold their ground. CAVA Group walked into that environment in Q1 2026 and put up numbers that made the rest of the category look sideways.

Revenue grew 32.2% year over year to $438.3 million, same-restaurant sales climbed 9.7%, and guest traffic was up 6.8%. That last number is the one that matters most right now. In a sector where traffic growth has become scarce, CAVA (CAVA) is consistently producing it at scale. Analysts at UBS, Baird, Stifel, and Argus all raised their price targets in the days that followed.

Now Live: Discover how much upside your favorite stocks could have using TIKR’s new Valuation Model (It’s free) >>>

The Q1 Numbers That Turned Heads

The traffic story is worth unpacking because same-restaurant sales growth can come from two places: more customers walking through the door, or higher prices. CAVA’s 9.7% comp was driven primarily by the former, with traffic accounting for 6.8 percentage points of that gain.

CEO Brett Schulman noted on the Q1 call that CAVA has taken lower prices than peers since 2019, with cumulative increases running below inflation. The brand is pulling customers in on the strength of the product, not by squeezing the check.

Adjusted EBITDA rose 37.6% to $61.7 million, beating the Street by nearly 8%. The company opened 20 net new restaurants in the quarter, bringing the total to 459 locations, with new units averaging $3 million in volume at 100% productivity or better almost immediately.

CAVA Group Total Revenues, EBITDA. (TIKR)

The revenue and EBITDA trajectory in that chart captures the operating leverage story in a single frame. Revenue has compounded from $500 million in 2021 to $1.18 billion in 2025, while EBITDA climbed from near breakeven to $134 million over the same period. The model is working.

See historical and forward estimates for CAVA stock (It’s free!) >>>

Expansion Is the Engine, but Margins Are the Debate

At 459 locations against a target of 1,000 by 2032, there is still a long runway ahead. Management raised full-year 2026 guidance to 75-77 net new restaurant openings, and the company announced plans to hire more than 2,500 employees this year to support that pace.

Restaurant-level profit margins held at 25.1% in Q1, flat year over year as efficiency gains were offset by higher delivery costs, wage investments, and the rollout of the Assistant General Manager role now in place at more than half of CAVA’s locations.

Full-year margin guidance of 23.7% to 24.3% reflects a roughly 100 basis point headwind from the new pomegranate glazed salmon offering and an additional 20 to 40 basis point drag from energy costs. These are deliberate investments in menu innovation and infrastructure, not signs of a business losing control of its cost structure.

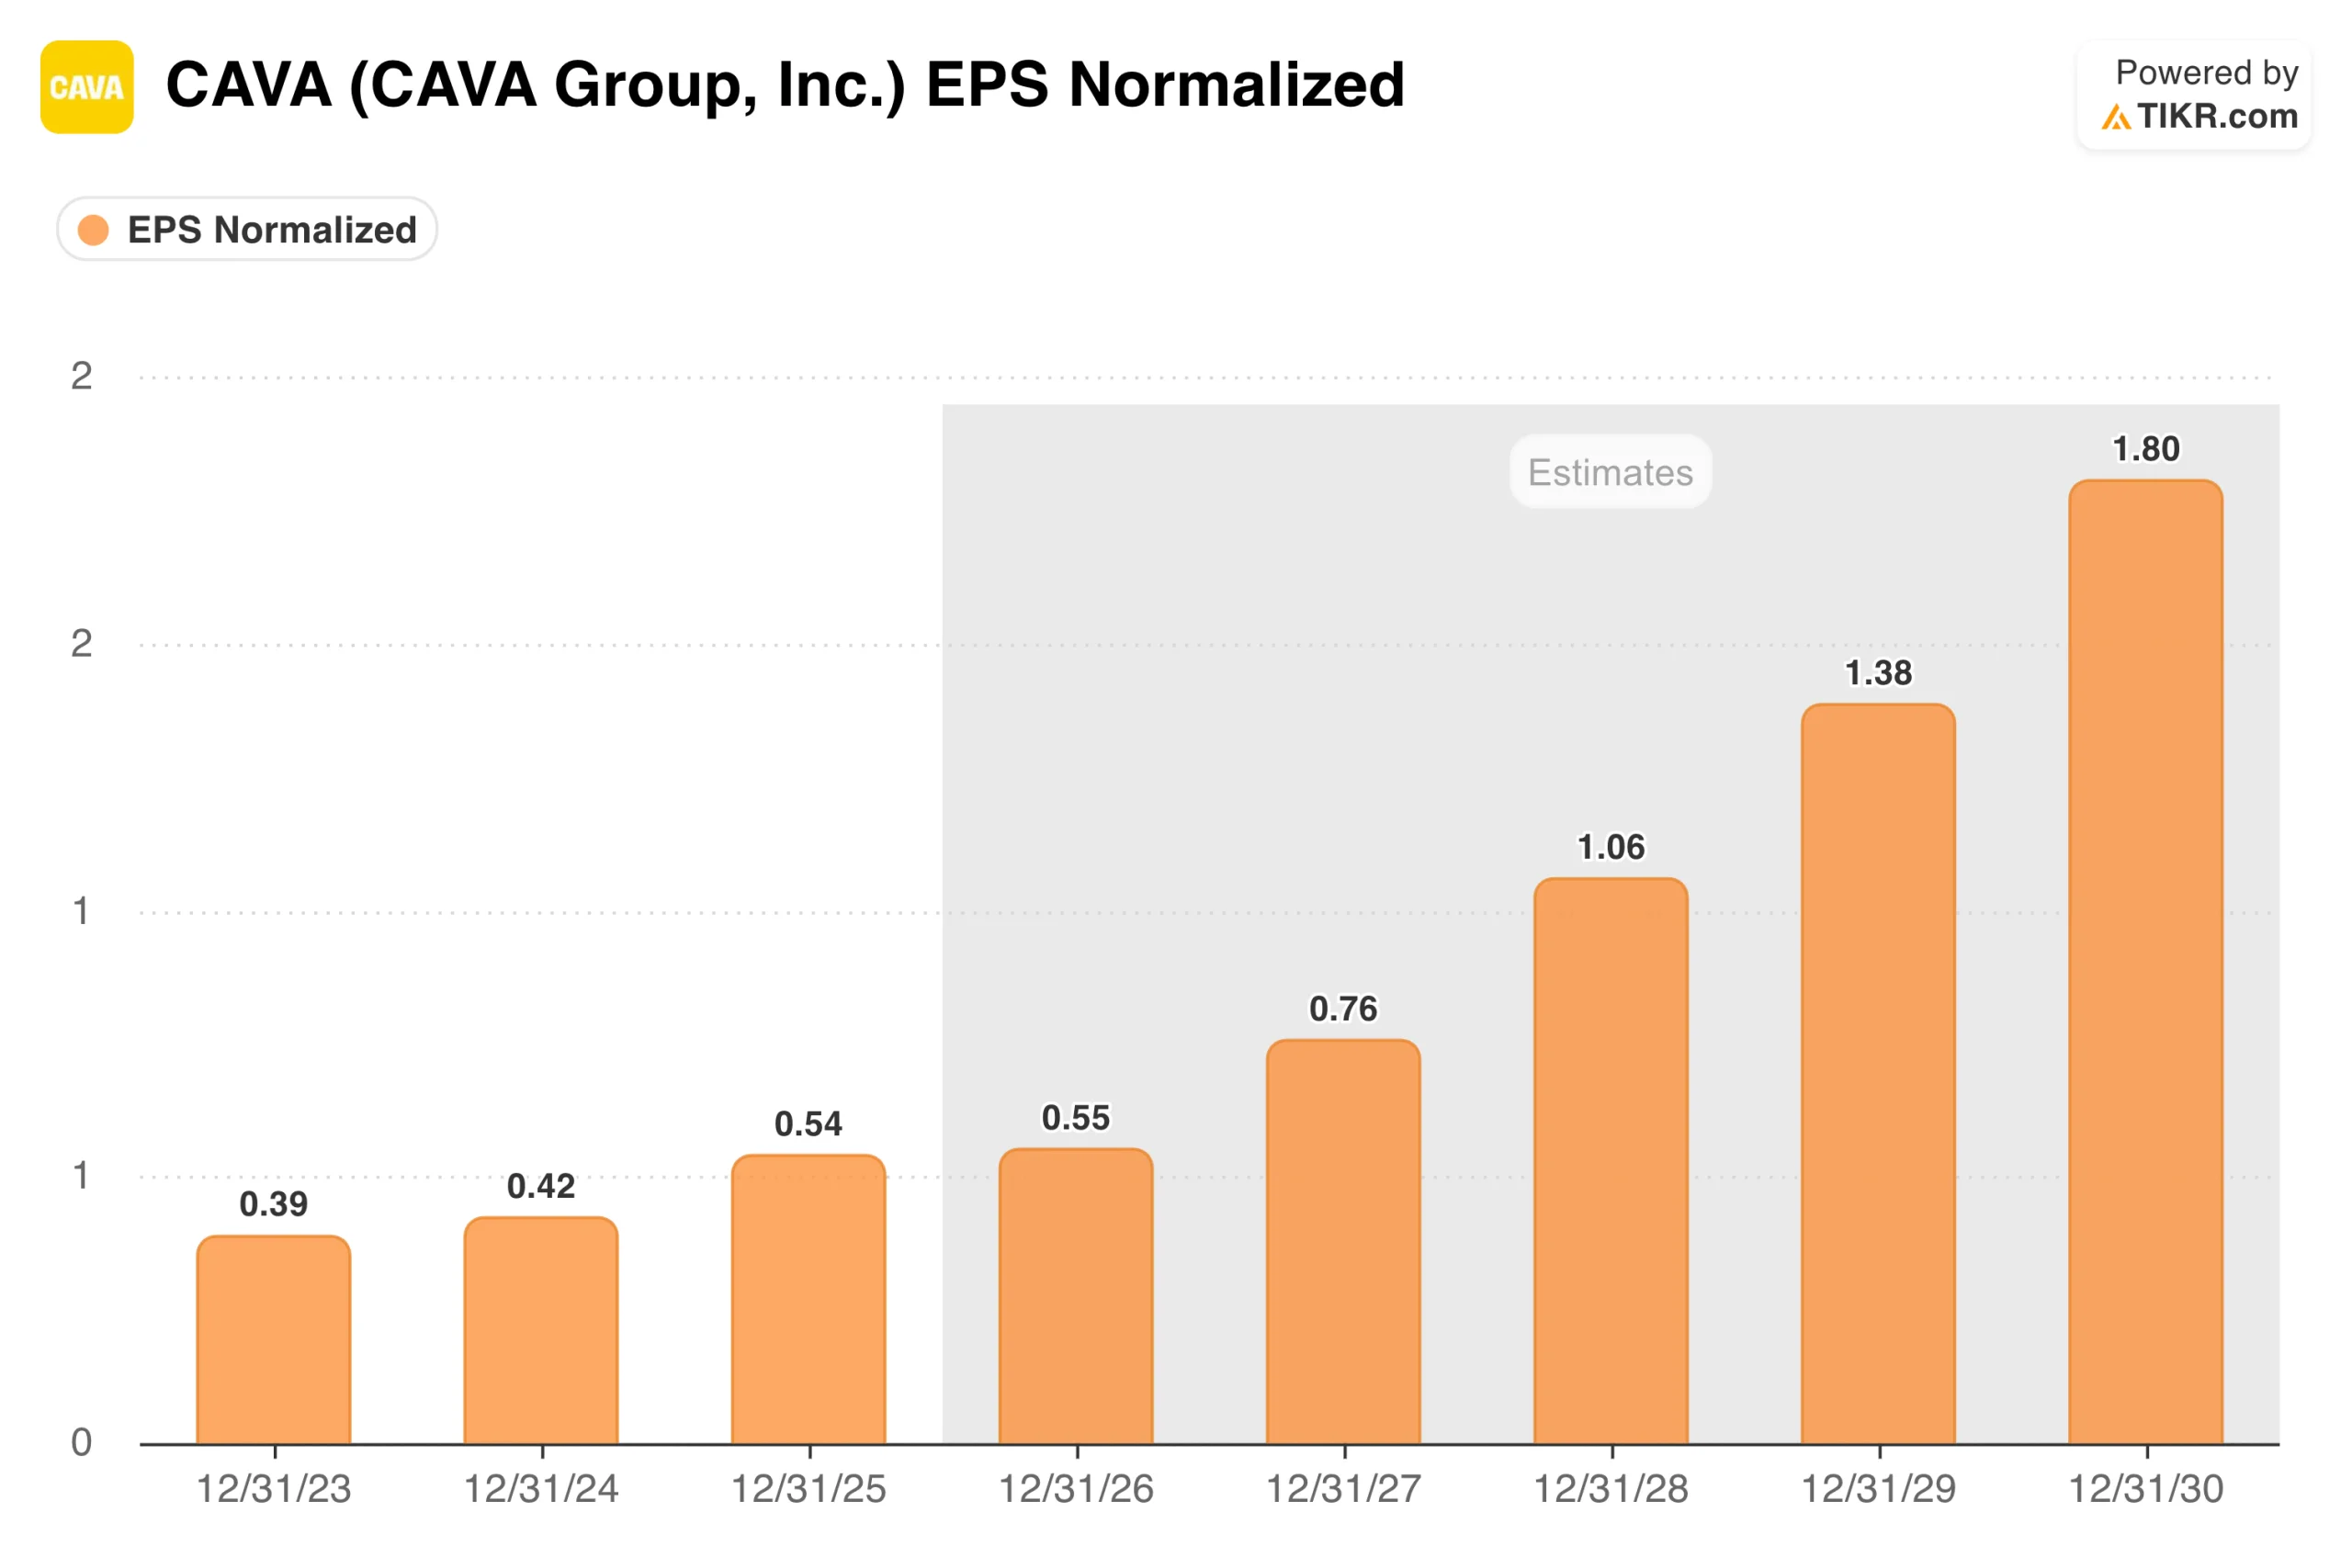
CAVA EPS Normalized. (TIKR)

Consensus has EPS growing from $0.54 in 2025 to around $0.55 in 2026, then accelerating toward $1.80 by 2030 as the unit count scales and operating leverage builds. The near-term flatness reflects those margin investments, management is accepting some short-term pressure on profitability in exchange for a larger, better-staffed restaurant base.

See how CAVA performs against its peers in TIKR (It’s free!) >>>

Priced for Perfection or Priced for What’s Coming

At around $91, CAVA trades at roughly 149 times forward earnings and about 52 times forward EBITDA, well above Chipotle and every other name in the fast-casual peer group. That premium is either the most important thing about the stock or a distraction from what the business is actually building, depending on your time horizon.

CAVA Valuation Model. (TIKR)

TIKR’s valuation model targets around $213 per share in the mid case, representing a potential total return of around 134% over the next 4.5 years at roughly 20% annualized.

The low case arrives near $290 at about a 14% IRR, the high case projects toward $560 at close to 24% annually. Across all three scenarios, returns are driven by earnings growth rather than multiple expansion. The model assumes modest P/E compression in the base case, meaning consistent execution is the price of admission, not a rerating.

The scenario range skews to the upside if same-store sales hold and new-unit productivity continues to outperform. Revenue growth of around 19% annually through 2035 is the key assumption, with net income margins expanding from around 5% today toward 7% as fixed costs get absorbed across a larger restaurant base.

What the Bulls Are Betting On

  • Traffic growth is durable. CAVA has produced positive traffic comps where most peers have not, and its below-inflation pricing strategy leaves room to take more price without pushing customers away.
  • Unit economics hold at scale. New stores are hitting $3 million AUV at full productivity from day one, suggesting the brand translates cleanly across new geographies.
  • The Chipotle comparison still has legs. Chipotle had roughly 500 locations when it went public and now operates more than 3,700. CAVA is earlier in that journey with a category tailwind that is arguably stronger today.
  • Technology is building a moat. The rollout of CAVA Core and CAVA Current is designed to drive personalization and repeat visits in ways legacy restaurant operators have not prioritized.

What the Bears Are Watching

  • The valuation leaves no margin for error. At roughly 149 times forward earnings, any stumble in same-store sales, margins, or new unit productivity will be punished quickly.
  • Near-term earnings growth is essentially flat. The EPS chart shows 2026 estimates barely above 2025 actuals, which is a hard pill to swallow at this multiple.
  • Margin investments are real costs. Salmon, AGM rollout, wage increases, and energy headwinds are all hitting simultaneously, and the full-year margin guide sits below last year’s restaurant-level result.
  • The Street is already skeptical. With the stock at $91 and the mean analyst target at $92, the market has essentially caught up to where most models land.

Review analysts’ growth forecasts and price targets for CAVA stock (It’s free!) >>>

Should You Invest in CAVA Group?

CAVA is one of the clearest growth stories in the restaurant sector, and Q1 showed the business is still executing.

Traffic is growing, new stores are productive, and the path to 1,000 locations is intact. The harder question is whether any of that is a surprise at this valuation, with the stock already up more than 100% off its lows and the mean analyst target sitting right at the current price.

For investors with a long time horizon and conviction in the category, CAVA remains one of the more compelling growth vehicles available. For those focused on near-term value, the entry point is a genuine challenge.

Looking for New Opportunities?

  • See what stocks billionaire investors are buying so you can follow the smart money.
  • Analyze stocks in as little as 5 minutes with TIKR’s all-in-one, easy-to-use platform.
  • The more rocks you overturn… the more opportunities you’ll uncover. Search 100K+ global stocks, global top investor holdings, and more with TIKR.

Disclaimer:

Please note that the articles on TIKR are not intended to serve as investment or financial advice from TIKR or our content team, nor are they recommendations to buy or sell any stocks. We create our content based on TIKR Terminal’s investment data and analysts’ estimates. Our analysis might not include recent company news or important updates. TIKR has no position in any stocks mentioned. Thank you for reading, and happy investing!

World Cup Combo: Aim for 200x

World Cup Combo: Aim for 200xWorld Cup Combo: Aim for 200x

Combine up to 20 World Cup matches in one order

Disclaimer: The articles reposted on this site are sourced from public platforms and are provided for informational purposes only. They do not necessarily reflect the views of MEXC. All rights remain with the original authors. If you believe any content infringes on third-party rights, please contact crypto.news@mexc.com for removal. MEXC makes no guarantees regarding the accuracy, completeness, or timeliness of the content and is not responsible for any actions taken based on the information provided. The content does not constitute financial, legal, or other professional advice, nor should it be considered a recommendation or endorsement by MEXC.

You May Also Like

Daily XRP transfer volume surpasses 500 million! What does this mean during the latest price drop?

Daily XRP transfer volume surpasses 500 million! What does this mean during the latest price drop?

🚨 Daily transfer volume in $XRP just topped 500 million XRP. 📈 Network usage fully rebounded after a big selloff while price is still weak. 🛡️ Over 145,000 users
Share
COINTURK EN2026/06/19 21:08
Ethereum koers toont zeldzaam dubbel koopsignaal en richt zich op $4.550

Ethereum koers toont zeldzaam dubbel koopsignaal en richt zich op $4.550

Connect met Like-minded Crypto Enthusiasts! Connect op Discord! Check onze Discord   Ethereum laat op de uurgrafiek twee opeenvolgende TD Sequential koopsignalen zien. Deze indicator meet uitputting in een trend en geeft vaak een signaal dat de verkoopdruk kan afnemen. Dit dubbele signaal verschijnt rond het niveau van $4.516, waar de ETH prijs kortstondig steun vindt. Dit type formatie komt zelden voor en wordt daarom extra nauwlettend gevolgd. Wat gaat de Ethereum koers hiermee doen? Ethereum koers test steun rond $4.516 De scherpe daling van de Ethereum koers vanaf de prijszone rond $4.800 bracht de ETH prijs in korte tijd naar ongeveer $4.516. Op dit niveau trad duidelijke koopactiviteit op, waardoor de neerwaartse beweging tijdelijk werd gestopt. Het dubbele signaal dat door de TD Sequential indicator is gegenereerd, viel precies samen met dit prijspunt. De TD Sequential is opgebouwd uit negen candles die een trend meetellen. Wanneer de negende candle verschijnt, kan dit duiden op een trendomslag. In dit geval verschenen zelfs twee signalen kort na elkaar, wat aangeeft dat de verkoopdruk mogelijk uitgeput is. Het feit dat dit gebeurde in een zone waar ETH kopers actief bleven, maakt het patroon extra opvallend. TD Sequential just flashed two buy signals for Ethereum $ETH! pic.twitter.com/JPO8EhiEPi — Ali (@ali_charts) September 16, 2025 Welke crypto nu kopen?Lees onze uitgebreide gids en leer welke crypto nu kopen verstandig kan zijn! Welke crypto nu kopen? Fed-voorzitter Jerome Powell heeft aangekondigd dat de rentes binnenkort zomaar eens omlaag zouden kunnen gaan, en tegelijkertijd blijft BlackRock volop crypto kopen, en dus lijkt de markt klaar om te gaan stijgen. Eén vraag komt telkens terug: welke crypto moet je nu kopen? In dit artikel bespreken we de munten die… Continue reading Ethereum koers toont zeldzaam dubbel koopsignaal en richt zich op $4.550 document.addEventListener('DOMContentLoaded', function() { var screenWidth = window.innerWidth; var excerpts = document.querySelectorAll('.lees-ook-description'); excerpts.forEach(function(description) { var excerpt = description.getAttribute('data-description'); var wordLimit = screenWidth wordLimit) { var trimmedDescription = excerpt.split(' ').slice(0, wordLimit).join(' ') + '...'; description.textContent = trimmedDescription; } }); }); Technische indicatoren schetsen herstelkans voor ETH Naast de dubbele koopsignalen verstrekken ook andere indicatoren belangrijke aanwijzingen. Tijdens de daling van de ETH koers waren grote rode candles zichtbaar, maar na de test van $4.516 stabiliseerde de Ethereum koers. Dit wijst op een mogelijke verschuiving in het evenwicht tussen de bears en bulls. Als deze opwaartse beweging doorzet, liggen de eerste weerstanden rond $4.550. Daarboven wacht een sterkere zone rond $4.650. Deze niveaus zijn in eerdere Ethereum sessies al meerdere keren getest. Een doorbraak zou ruimte openen richting de all-time high van ETH rond $4.953. Wanneer de prijs toch opnieuw onder $4.516 zakt, liggen er zones rond $4.500 en $4.450 waar grotere kooporders worden verwacht. Deze niveaus kunnen als een vangnet fungeren, mocht de druk opnieuw toenemen. Marktdynamiek bevestigt technische indicatoren De huidige situatie volgt op een bredere correctie in de cryptomarkt. Verschillende vooraanstaande crypto tokens zagen scherpe koersdalingen, waarna traders op zoek gingen naar signalen voor een mogelijke ommekeer. Dat juist Ethereum nu een dubbel TD Sequential signaal toont, versterkt de interesse in dit scenario. Fundamenteel blijft Ethereum sterk. Het aantal ETH tokens dat via staking is vastgezet, blijft groeien. Dat verkleint de vrije circulatie en vermindert verkoopdruk. Tegelijk blijft het netwerk intensief gebruikt voor DeFi, NFT’s en stablecoins. Deze activiteiten zorgen voor een stabiele vraag naar ETH, ook wanneer de prijs tijdelijk onder druk staat. Fundamentele drijfveren achter de Ethereum koers De Ethereum koers wordt echter niet alleen bepaald door candles en patronen, maar ook door bredere factoren. Een stijgend percentage van de totale ETH supply staat vast in staking contracten. Hierdoor neemt de liquiditeit op exchanges af. Dit kan prijsschommelingen versterken wanneer er plotseling meer koopdruk ontstaat. Daarnaast is Ethereum nog steeds het grootste smart contract platform. Nieuwe standaarden zoals ERC-8004 en ontwikkelingen rond layer-2 oplossingen houden de activiteit hoog. Deze technologische vooruitgang kan de waardepropositie ondersteunen en zo indirect bijdragen aan een ETH prijsherstel. Het belang van de korte termijn dynamiek De komende handelsdagen zullen duidelijk maken of de bulls genoeg kracht hebben om door de weerstandszone rond $4.550 te breken. Voor de bears ligt de focus juist op het verdedigen van de prijsregio rond $4.516. De whales, die met grote handelsorders opereren, kunnen hierin een beslissende rol spelen. Het dubbele TD Sequential signaal blijft hoe dan ook een zeldzame gebeurtenis. Voor cryptoanalisten vormt het een objectief aanknopingspunt om de kracht van de huidige Ethereum trend te toetsen. Vooruitblik op de ETH koers Ethereum liet twee opeenvolgende TD Sequential signalen zien op de uurgrafiek, iets wat zelden voorkomt. Deze formatie viel samen met steun rond $4.516, waar de bulls actief werden. Als de Ethereum koers boven dit niveau blijft, kan er ruimte ontstaan richting $4.550 en mogelijk $4.650. Zakt de prijs toch opnieuw onder $4.516, dan komen $4.500 en $4.450 in beeld als nieuwe steunzones. De combinatie van zeldzame indicatoren en een sterke fundamentele basis maakt Ethereum interessant voor zowel technische als fundamentele analyses. Of de bulls het momentum echt kunnen overnemen, zal blijken zodra de Ethereum koers de eerstvolgende weerstanden opnieuw test. Koop je crypto via Best Wallet Best wallet is een topklasse crypto wallet waarmee je anoniem crypto kan kopen. Met meer dan 60 chains gesupport kan je al je main crypto coins aanschaffen via Best Wallet. Best wallet - betrouwbare en anonieme wallet Best wallet - betrouwbare en anonieme wallet Meer dan 60 chains beschikbaar voor alle crypto Vroege toegang tot nieuwe projecten Hoge staking belongingen Lage transactiekosten Best wallet review Koop nu via Best Wallet Let op: cryptocurrency is een zeer volatiele en ongereguleerde investering. Doe je eigen onderzoek. Het bericht Ethereum koers toont zeldzaam dubbel koopsignaal en richt zich op $4.550 is geschreven door Dirk van Haaster en verscheen als eerst op Bitcoinmagazine.nl.
Share
Coinstats2025/09/17 23:31
UK Gilt Yields Spike As Burnham Win Opens Door To Oust Starmer

UK Gilt Yields Spike As Burnham Win Opens Door To Oust Starmer

UK Gilt Yields Spike As Burnham Win Opens Door To Oust Starmer The odds of embattled UK Prime Minister Keir Starmer being ousted by the end of July
Share
ZeroHedge2026/06/19 21:05

Score Your Share of 50K USDT

Score Your Share of 50K USDTScore Your Share of 50K USDT

Complete DEX+ tasks to unlock the Champion Wheel