

Bitcoin Cash: price +7% at $647, breakout and key levels (09/18/2025)
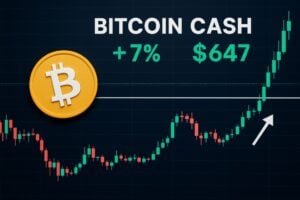
Bitcoin Cash gains 7% and reaches $647, at highs not seen since last April: the movement fits into a risk-on climate, driven by speculation of new US ETFs Reuters and by a technical breakout that revives the trend. In this context, here’s what changes and which levels to follow.
According to data collected by our research desk, there has been an increase in participation on spot and futures order books for BCH over the last 48 hours, with heightened activity on major exchanges.
The analysts from the team also observe a relative increase in open interest, an element that has helped sustain the movement during the breakout. For more insights into the exchanges and prices of Bitcoin Cash (BCH), please refer to our latest report.
Rally in numbers: what happened
The price of BCH has advanced by 7% in the last 24 hours, peaking at $646 and an intraday update to $647. According to data from CoinDesk, the rebound brings the asset back to the highs observed since April 2024, after weeks of bearish pressure that had slowed the momentum.
The return of liquidity to the market and the improvement in sentiment – also highlighted by the recent Fed rate cut, as reported by Reuters – have favored widespread buying.
Indeed, short-term trading activity has also increased, demonstrating greater risk tolerance and a rotation towards high-beta assets.
Key Metrics (update September 18, 2025)
- Indicative price: $647 (intraday)
- 24h Change: +7%
- 24h Range: data updating
- 24h Volume: data updating
- Market cap: data being updated
- Circulating supply: data being updated
- Price source: CoinDesk; sentiment: Santiment (X)
Why BCH Rose: Macro and Regulatory Context
The BCH rally fits into a more favorable macro context. Expectations of lower rates in the USA – confirmed by the recent Fed rate cut Reuters – have helped reduce stress on the dollar, pushing more volatile assets towards greater consolidation. In this framework, the debate on new US crypto ETFs has galvanized institutional interest.
On the regulatory front, decisions like that of the Securities and Exchange Commission to approve generic standards for the listing of ETFs linked to commodities and crypto support sentiment, although the concrete outcomes remain yet to be defined.
For further insights and weekly analyses on flows towards digital asset products, refer also to industry reports such as CoinShares Research. While awaiting further details, for official documents refer to the institutional portals of the Federal Reserve and the SEC.
The excitement around crypto ETFs has historically favored the expansion of spot demand, catalyzing further investments.
Technical Analysis: Breakouts and Levels to Monitor
The technical framework has further strengthened with a confirmed breakout in July, which saw the price of BCH surpass the upper line of a channel formed by the highs of April 2024 and December 2024, and the lows of August 2024 and April 2025.
That said, the exit from the structure indicates the absorption of bearish pressure and an improvement in momentum.
Key Technical Levels
- Immediate resistance: $700 area (psychological)
- Key resistance: $719, corresponding to the 2024 high
- Dynamic supports: area of the broken channel (retest), with a focus on recent local lows
- Historical context: channel reference highs – April 2024 and December 2024; lows – August 2024 and April 2025
A close above $700 would confirm the signal of strength. Conversely, a clear rejection of these supports would increase the risk of a return of volatility.
Market on Track: Rotation to Altcoins
The risk-on climate has also involved other mid-cap altcoins. In recent movements, tokens like DOT, SUI, JUP, and NEAR have shown resilience, while smaller cryptocurrencies like PENGU have recorded double-digit shifts, highlighting the market’s inclination to seek returns in a context of growing confidence.
- Mid-cap in focus: DOT, SUI, JUP, NEAR
- Speculative/meme: PENGU
- Common driver: improvement in sentiment and greater risk appetite
Regulatory Impact: What Can Change
Clearer standards for the listing of crypto ETFs could reduce uncertainty and simplify the arrival of new products. However, approval times and requirements remain at the discretion of the authorities, with processes that could be prolonged and require additional documentation.
The message for the market is that greater regulatory transparency could encourage more stable capital inflows, while maintaining a risk buffer that could reignite volatility in the absence of definitive decisions.
Stability of the $647 Level: Assessment and Scenarios
The intraday level at $647 marks an improvement in momentum, but it does not represent a definitive threshold. Its confirmation will depend on trading volumes and the price reaction in the resistance zones at $700–$719.
In this context, a breakout above these levels could validate the continuation of the trend, while a strong rejection could push the price towards the channel supports.
Transitions and Reading the Big Picture
In summary, the recent BCH rally stems from the intersection of three factors: a more favorable macroeconomic context, an evolving regulatory narrative, and a credible technical signal.
The synergy between these elements amplifies the potential trend, while still leaving room for possible corrections in case of surprises related to rates, regulation, or liquidity.
Note on sources and data
- Price and changes: CoinDesk
- Sentiment and on-chain activity: Santiment on X
- Official documents: Federal Reserve; SEC
To be integrated, when available: precise timestamp of the peak (UTC/CET time), volumes and market cap at the time of the intraday high, direct link to the specific SEC document on the listing standards mentioned.
Conclusion
The movement of BCH combines technical elements and macroeconomic factors. The recent breakout strengthens the token’s outlook, while the anticipation of lower rates and the approval of crypto ETFs supports sentiment.
The next hurdles to overcome are the $700 area and the resistance at $719, levels that will provide crucial indications on the continuation of the trend.
You May Also Like

XRP News: Ripple Plans BC Payments Deal to Expand Payments in Australia

'Red flag' raised that 'Machiavellian' Trump aide is building MAGA army to outlast Trump
