

Microsoft Stock Trapped: $190B AI Bet Collides With 4,800 Layoffs
Microsoft stock sits at $386.74 on July 6, virtually flat and straddling its daily pivot point. MSFT trades well below both the 50-day and 200-day EMAs, painting a neutral-to-cautiously-bearish picture. A $190 billion AI capex commitment and 4,800 job cuts deepen the uncertainty around the stock’s next move.
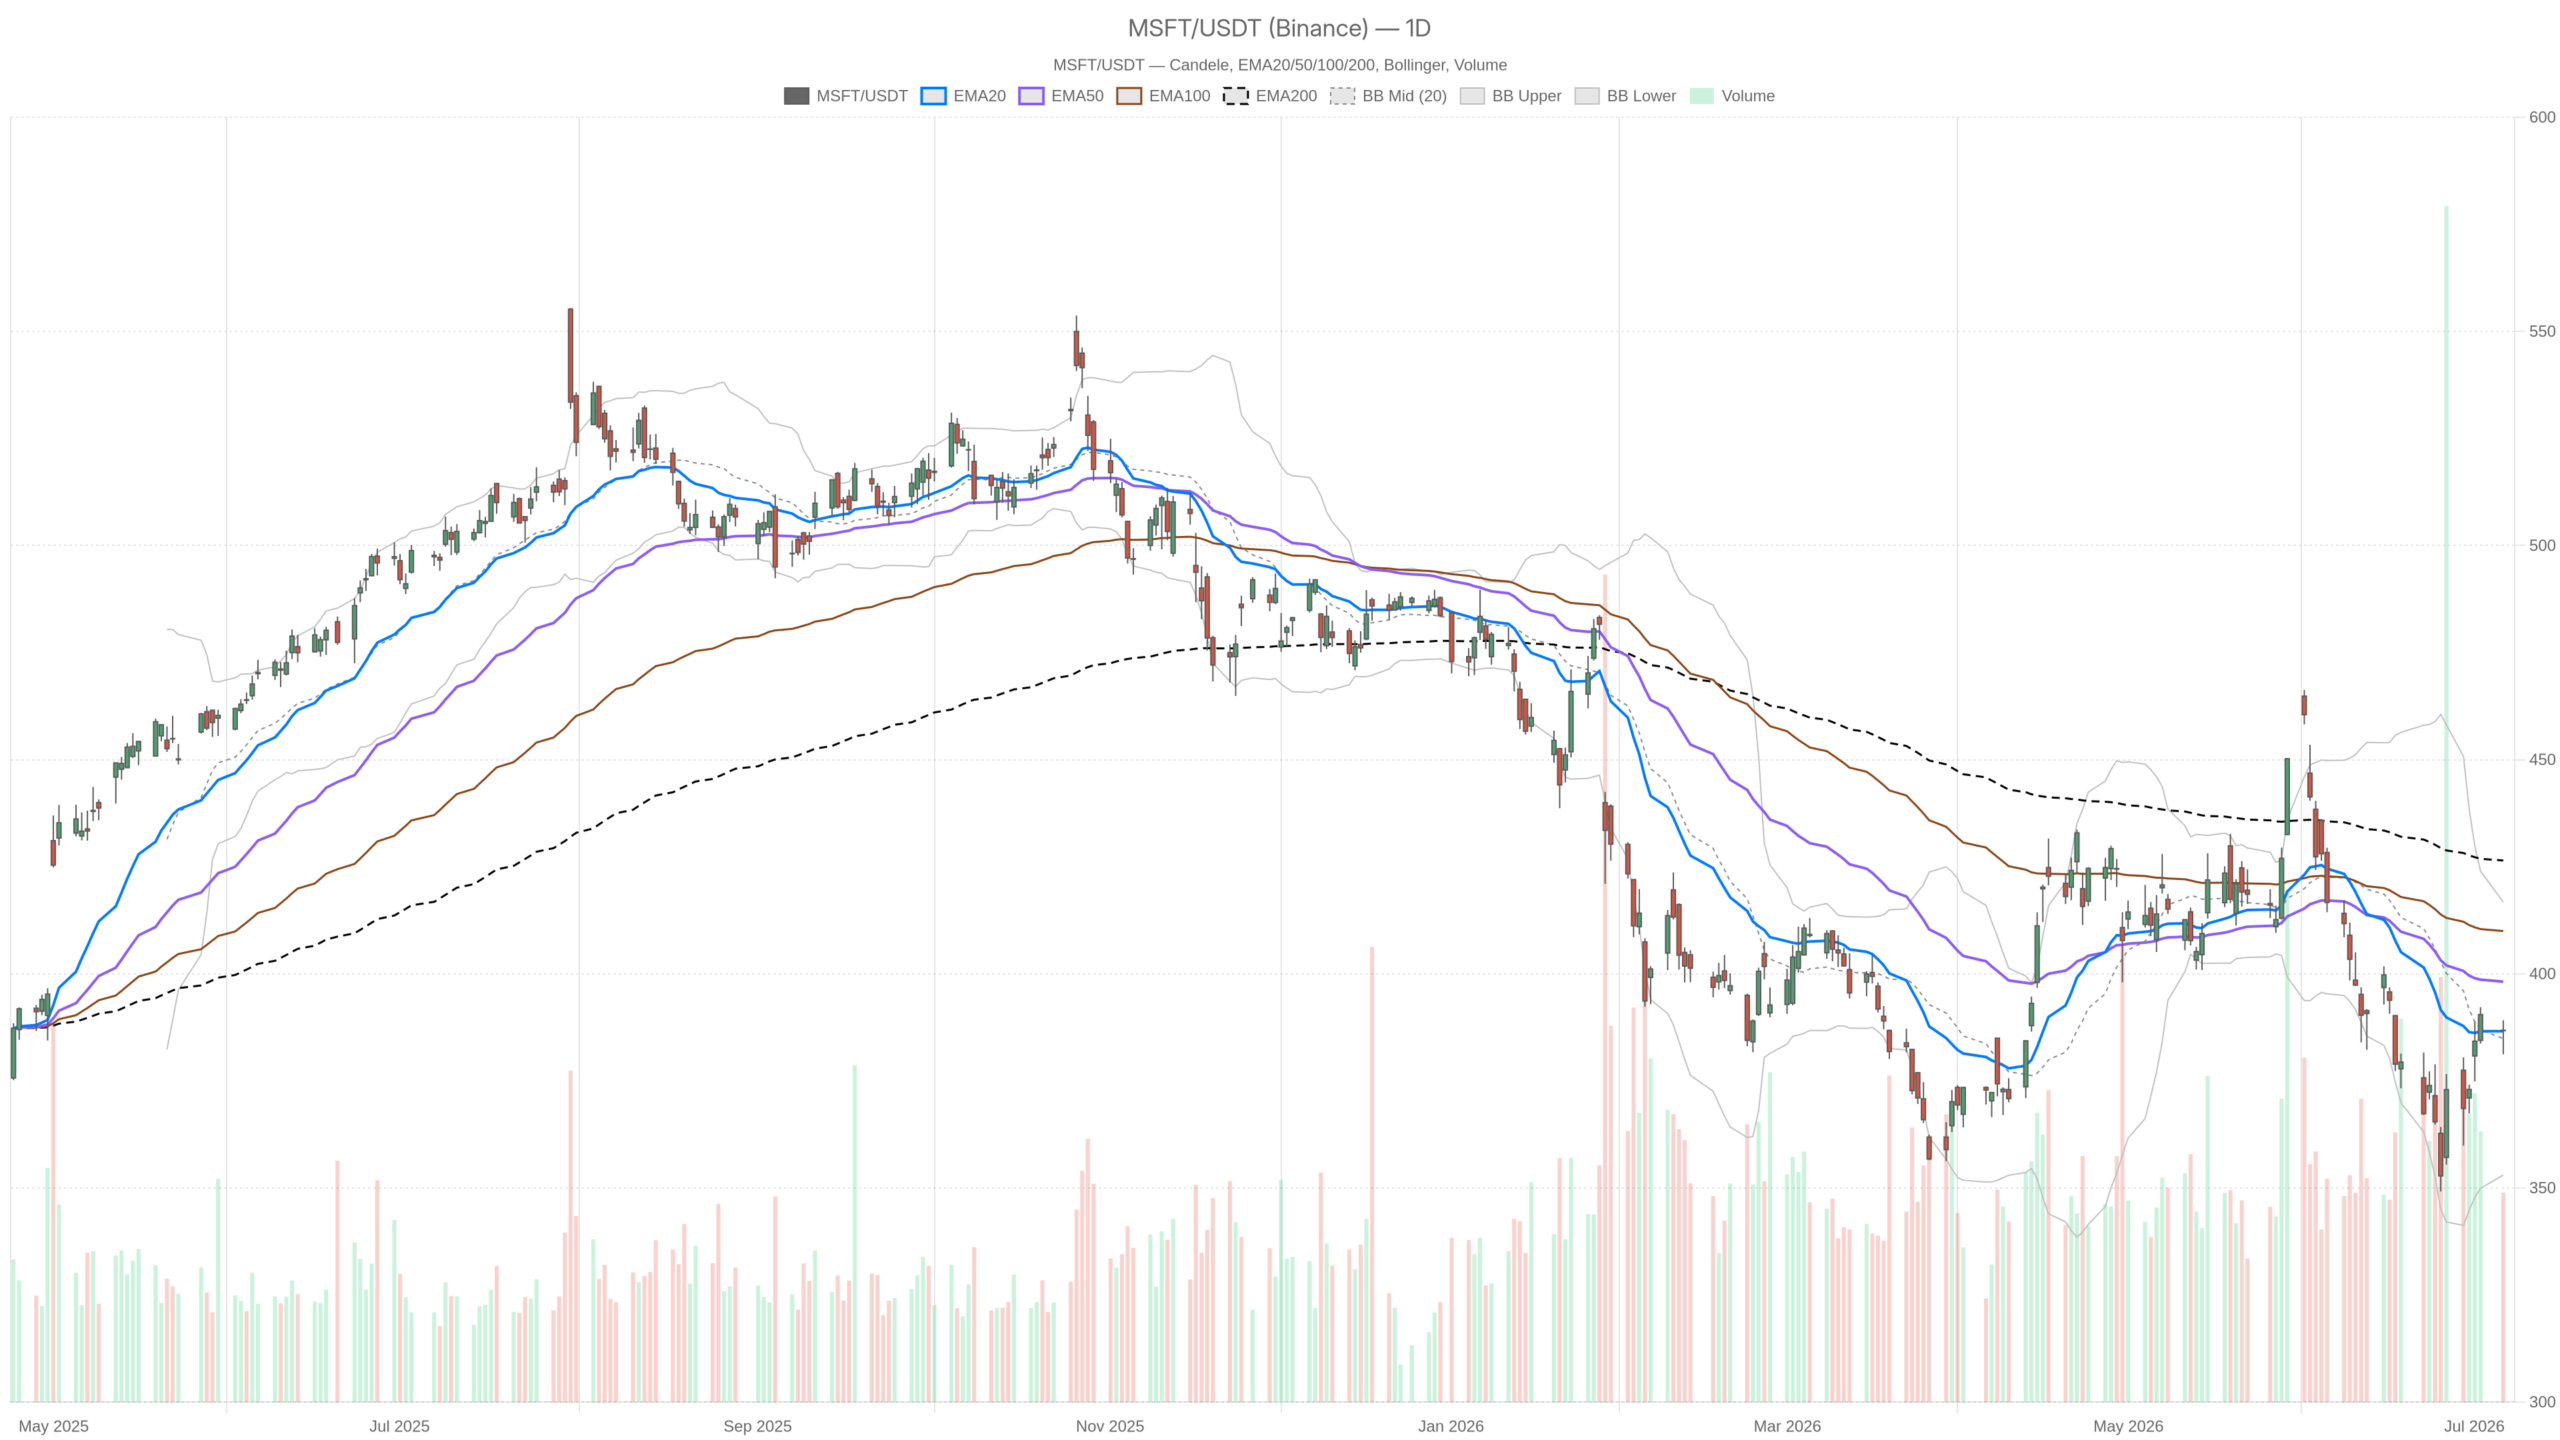 MSFT — daily chart with candlesticks, EMA20/EMA50 and volume.
Key takeaways
- MSFT closed at $386.74 on July 6, virtually flat and trading below both its 50-day EMA ($398.18) and 200-day EMA ($426.47).
- The daily RSI at 48.11 and MACD at -8.65 confirm a neutral-to-bearish structural regime, though the MACD histogram has turned positive at +1.85.
- Microsoft is committing approximately $190 billion in capex to AI and Azure infrastructure while cutting roughly 4,800 jobs, including significant Xbox layoffs.
- Key levels: $382.26 support and $390.19 resistance on the daily frame; a break of either could define the next directional move for MSFT.
- The daily ATR of $13.15 signals elevated volatility, demanding disciplined position sizing from both bulls and bears.
Microsoft Stock Daily Bias: Neutral, With a Bearish Lean
MSFT’s daily bias is neutral with a bearish lean. The EMA structure confirms downward pressure, with price trapped well below key moving averages.
EMA Structure Confirms Bearish Alignment
The daily chart carries the weight of the broader trend. Microsoft stock hovers right at the 20-day EMA of $386.62. This offers thin near-term support. However, the 50-day EMA sits at $398.18 and the 200-day EMA at $426.47. Both are well above current price. That stacked bearish alignment means any meaningful rally faces layered overhead resistance before structural health can return.
Pivot levels add useful granularity. The daily pivot point sits at $385.70, close to where price closed. First resistance is at $390.19 and initial support at $382.26. A close below $382 would be a tangible deterioration signal on the daily frame.
Momentum Indicators Signal Early Stabilization
The daily RSI at 48.11 is consistent with the neutral regime label. It is neither oversold nor showing real bullish conviction. Momentum is simply absent at the daily level. Meanwhile, the MACD tells a more nuanced story. The line at -8.65 and the signal at -10.50 remain negative. Yet the histogram has turned positive at +1.85. That flip signals selling pressure is easing — not that buyers have taken control.
Bollinger Bands on the daily frame place the midline at $384.89, with MSFT trading just above it. The wide band spread — from $353.02 to $416.76 — reflects the elevated volatility of recent weeks. Meanwhile, daily ATR of $13.15 confirms single-session swings remain meaningful. Traders cannot treat this as a low-volatility consolidation.
MSFT Hourly Structure Offers a Modest Lift
The 1H chart offers a modest lift but no trend reversal for Microsoft stock. Short-term structure is more constructive than the daily, yet momentum is already fading.
On the 1H chart, price at $386.90 trades above both the 20-hour EMA ($385.00) and 50-hour EMA ($380.65). This is a mild positive for intraday structure. The 1H RSI at 56.91 suggests buyers have a slight edge in short-term session flow.
In contrast, the 1H MACD complicates the picture. The line stands at +2.74 but the histogram has turned negative at -0.88. This means the hourly momentum impulse is already fading. It is a soft warning sign for anyone expecting a clean intraday continuation higher. The 1H EMA 200 at $392.10 looms as significant resistance. It aligns closely with the daily EMA-50 zone around $398, creating a meaningful supply cluster above.
Overall, the hourly frame confirms a mild short-term recovery attempt. However, it does not override the bearish daily bias. It complicates rather than contradicts it.
15-Minute Chart Offers Tactical Execution Context
The 15-minute chart provides tactical entry context but carries no structural weight for MSFT. The regime is technically bullish for short-term execution only.
The 15-minute structure is labeled bullish, and the chart reflects that. All three EMAs are stacked constructively. Price sits above the 20 EMA ($386.17). The 20 EMA is above the 50 EMA ($385.97). And the 200 EMA sits well below at $379.65. The 15m MACD histogram has turned positive at +0.27. RSI at 54.19 is neutral-to-positive.
For short-term traders, the 15m chart provides entry context for tactical long positions. Specifically, this applies above the 15m pivot support at $386.39, targeting the $387.31 resistance level. That said, the 15m timeframe carries no weight in defining the structural trend. It is execution context only, and should not be mistaken for a directional call on Microsoft stock.
Microsoft Stock and the AI Pivot: Catalyst or Cost Center?
Microsoft’s AI pivot remains the central fundamental debate for MSFT. The $190 billion capex commitment clashes with near-term margin pressure and workforce reductions.
The fundamental narrative is loud and genuinely divided. The company is cutting roughly 4,800 jobs — approximately 2.1% of its workforce. At the same time, it is committing roughly $190 billion in capital expenditure in calendar 2026. This is directed almost entirely at AI infrastructure and Azure data centers. DA Davidson analyst Gil Luria put it directly: every investment dollar is now going toward AI, and Xbox has become “almost irrelevant.”
The layoffs hit the Xbox division particularly hard. This sparked a short-term sentiment drag on Microsoft stock. Yet some analysts argue this is exactly the right capital allocation decision. It is painful in the near term but strategically sound over a longer horizon.
One camp frames Microsoft as one of the most mispriced AI stocks available today. The company bears the brunt of broader software sector negativity while quietly building a dominant AI and cloud infrastructure position. Higher component prices are also cited as a headwind squeezing margins across major tech names, including both Microsoft and Apple.
The tension between near-term earnings pressure and long-term AI upside is precisely what makes MSFT difficult to read right now. The market has not yet decided which narrative dominates.
Microsoft Stock Bullish Scenario: What Would Support a Recovery
A bullish recovery for Microsoft stock requires sequential technical reclaims. Price must hold above $382.26 and close above $390.19 before challenging the critical $398 zone.
The bullish case requires a series of technical steps. First, price needs to hold above $382.26 daily support. Then it must close convincingly above the $390.19 daily R1. Beyond that, a reclaim of the $398 zone — where the daily EMA-50 sits — would represent the first genuine structural improvement.
Fundamentally, the bull thesis rests on the AI capex cycle generating accelerating Azure revenue growth. If Microsoft’s $190 billion investment begins delivering measurable revenue impact, the current price level could in retrospect look like an attractive entry point. Any positive commentary on AI monetization from management would likely accelerate that repricing.
Microsoft Stock Bearish Scenario: What Would Invalidate the Bull Case
The bearish scenario is the path of least resistance for MSFT given the EMA structure. A daily close below $382.26 would confirm renewed selling pressure and invalidate the recovery attempt.
A break below $382.26, followed by a loss of the $380 psychological level, would confirm renewed downside momentum. The daily MACD line, despite the histogram improvement, remains deeply negative at -8.65. If the histogram fails to continue recovering, the dead-cat-bounce thesis gains traction.
Fundamentally, the risk is clear. If the $190 billion capex commitment weighs on free cash flow without near-term AI revenue acceleration, valuation concerns will intensify. The risk of earnings disappointment in that scenario is real for Microsoft stock.
Positioning, Volatility, and the Core Uncertainty
Microsoft stock sits in a contested range with a bearish structural lean and no clear catalyst. Elevated volatility demands disciplined positioning from both bulls and bears.
The daily ATR of $13.15 means position sizing deserves genuine respect. The stock can move sharply in either direction on any AI-related headline or broader tech sentiment shift. Traders operating near the $386–$387 zone should recognize they are in a contested range, not a trending environment.
The key levels to watch are $382 to the downside and $390–$398 to the upside. Until one of those zones breaks with conviction, MSFT remains a stock in search of a catalyst — and a market waiting to be convinced.
FAQ
What is the technical outlook for Microsoft stock right now?
The daily bias for Microsoft stock is neutral with a bearish lean. Price at $386.74 trades below both the 50-day EMA ($398.18) and 200-day EMA ($426.47), forming a bearish EMA stack. The daily RSI at 48.11 confirms the absence of directional momentum, while the MACD histogram has turned positive at +1.85, signaling that selling pressure is easing but not yet reversing.
What are the key support and resistance levels for MSFT?
Key daily support sits at $382.26, with the $380 psychological level acting as a secondary floor. On the upside, daily R1 resistance is at $390.19, while the critical $398 zone — where the daily EMA-50 resides — represents the first genuine structural reclaim target. The 1H EMA 200 at $392.10 adds an intermediate resistance layer between the two.
Is Microsoft’s AI investment strategy bullish or bearish for the stock?
The strategy is contested. The $190 billion capex commitment to AI infrastructure and Azure is viewed by some analysts as a long-term strategic advantage, positioning Microsoft as a potentially mispriced AI stock. However, others point to near-term margin pressure, 4,800 job cuts, and higher component costs as tangible headwinds. The market has not resolved this debate, which is precisely why MSFT lacks clear directional conviction.
Disclaimer: This article is for informational purposes only and does not constitute financial advice, an investment recommendation, or a solicitation to buy or sell any financial instrument or cryptocurrency. The analysis provided is not indicative of future results. Investing in crypto assets and financial markets carries a high risk of capital loss. Always do your own research (DYOR) and consult a qualified financial advisor before making any decision.
Article produced with the assistance of artificial intelligence and reviewed by the editorial team.


You May Also Like

Robotics Automation Prototyping: Engineering Kinetic Agility into End-Effectors

Bitcoin Exchange Binance Announces New Listings on its Futures Platform! Here Are the Details

Alabama Enacts Dual Legislative Breakthrough in Blockchain and Judicial Reform



