On January 17, 2025, the seven-day moving average (7DMA) of the number of transactions on the Ethereum network reached 2.43 million, according to a dashboard byOn January 17, 2025, the seven-day moving average (7DMA) of the number of transactions on the Ethereum network reached 2.43 million, according to a dashboard by

The Number of Transactions on the Ethereum Network Has Reached a New ATH

  • On January 17, the average number of transactions on the Ethereum network reached 2.43 million.
  • This is a new all-time high.
  • Fees also fell, to $0.15.
  • This indicates growing activity, but also makes Ethereum inflationary.

On January 17, 2025, the seven-day moving average (7DMA) of the number of transactions on the Ethereum network reached 2.43 million, according to a dashboard by The Block. This is a new all-time high.

As can be seen in the chart below, the metric has been growing since mid-December 2025, when the Fusaka upgrade was deployed on the mainnet. The previous all-time high was set in May 2021.

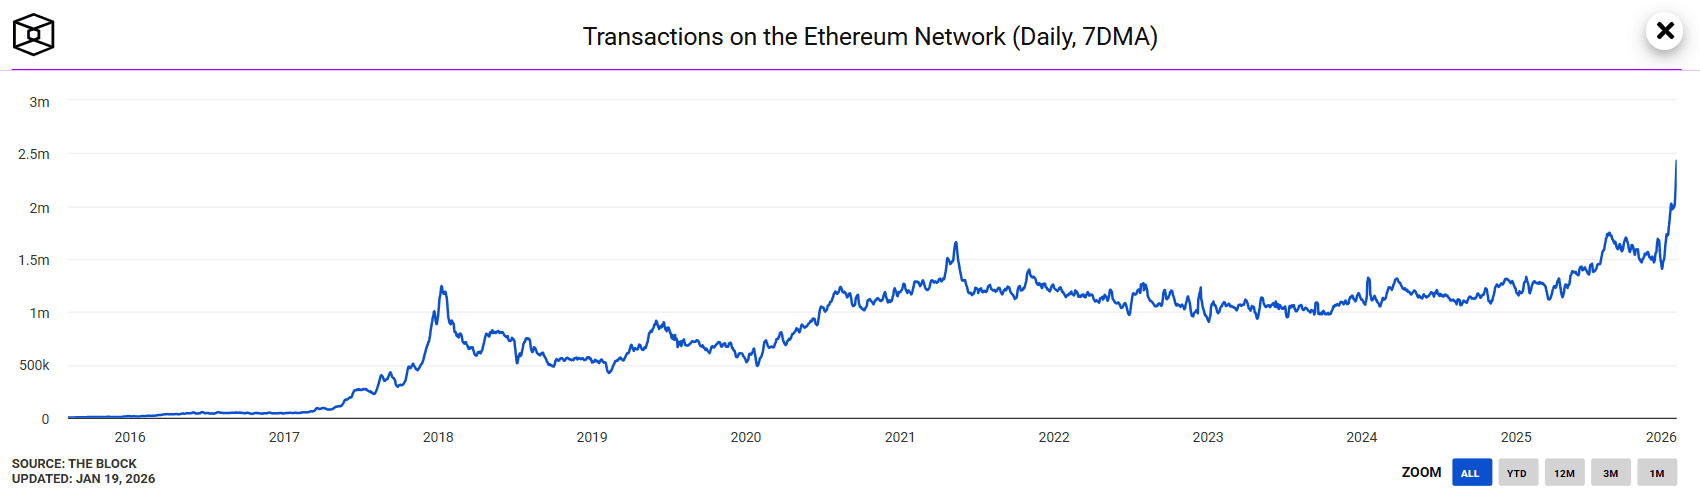
7DMA metric of the number of transactions on the Ethereum network. Source: The Block.

Stable low gas fees contributed to the growth in user activity. The 7DMA for this indicator fell to $0.15 as of January 17.

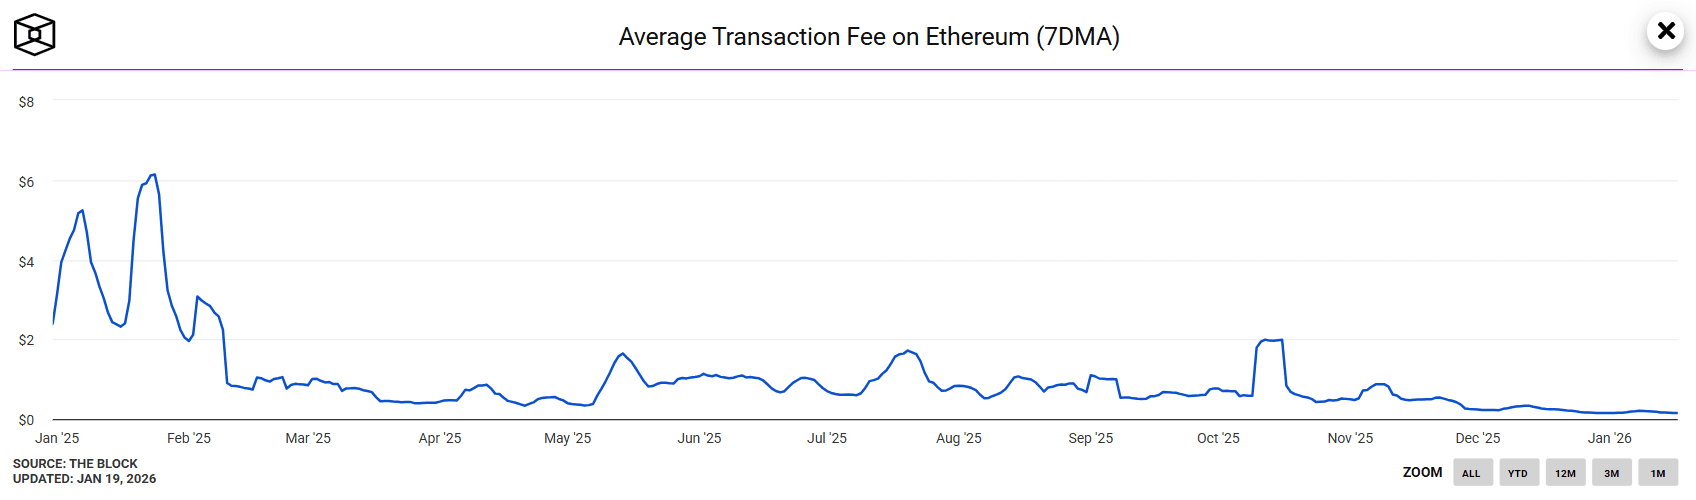
7DMA metric of gas fees on the Ethereum network. Source: The Block.

We covered the Fusaka upgrade in more detail in a separate article. The hard fork, among other things, increased blob space and implemented PeerDAS (Peer Data Availability Sampling).

Before that, the network recorded a record daily increase in new wallets.

All this indicates that the ecosystem is showing signs of revival at the fundamental level. The growth in the number of new addresses points to an influx of users, while the expansion of the gas limit reduces the load on the network and makes transaction costs more predictable. 

At the same time, the reduction in fees and, consequently, the volume of Ethereum burning negatively affects the deflationary nature of the asset.

In particular, according to the Ultrasound Money portal, the coin supply is growing by 0.8% per year. At the same time, the increase in the volume of assets in staking only exacerbates this trend.

Market Opportunity
Aethir Logo
Aethir Price(ATH)
$0.008408
$0.008408$0.008408
-2.65%
USD
Aethir (ATH) Live Price Chart
Disclaimer: The articles reposted on this site are sourced from public platforms and are provided for informational purposes only. They do not necessarily reflect the views of MEXC. All rights remain with the original authors. If you believe any content infringes on third-party rights, please contact service@support.mexc.com for removal. MEXC makes no guarantees regarding the accuracy, completeness, or timeliness of the content and is not responsible for any actions taken based on the information provided. The content does not constitute financial, legal, or other professional advice, nor should it be considered a recommendation or endorsement by MEXC.

You May Also Like

The Surprising 2025 Decline In Online Interest Despite Market Turmoil

The Surprising 2025 Decline In Online Interest Despite Market Turmoil

The post The Surprising 2025 Decline In Online Interest Despite Market Turmoil appeared on BitcoinEthereumNews.com. Bitcoin Searches Plunge: The Surprising 2025
Share
BitcoinEthereumNews2026/01/21 14:56
Cryptos Signal Divergence Ahead of Fed Rate Decision

Cryptos Signal Divergence Ahead of Fed Rate Decision

The post Cryptos Signal Divergence Ahead of Fed Rate Decision appeared on BitcoinEthereumNews.com. Crypto assets send conflicting signals ahead of the Federal Reserve’s September rate decision. On-chain data reveals a clear decrease in Bitcoin and Ethereum flowing into centralized exchanges, but a sharp increase in altcoin inflows. The findings come from a Tuesday report by CryptoQuant, an on-chain data platform. The firm’s data shows a stark divergence in coin volume, which has been observed in movements onto centralized exchanges over the past few weeks. Bitcoin and Ethereum Inflows Drop to Multi-Month Lows Sponsored Sponsored Bitcoin has seen a dramatic drop in exchange inflows, with the 7-day moving average plummeting to 25,000 BTC, its lowest level in over a year. The average deposit per transaction has fallen to 0.57 BTC as of September. This suggests that smaller retail investors, rather than large-scale whales, are responsible for the recent cash-outs. Ethereum is showing a similar trend, with its daily exchange inflows decreasing to a two-month low. CryptoQuant reported that the 7-day moving average for ETH deposits on exchanges is around 783,000 ETH, the lowest in two months. Other Altcoins See Renewed Selling Pressure In contrast, other altcoin deposit activity on exchanges has surged. The number of altcoin deposit transactions on centralized exchanges was quite steady in May and June of this year, maintaining a 7-day moving average of about 20,000 to 30,000. Recently, however, that figure has jumped to 55,000 transactions. Altcoins: Exchange Inflow Transaction Count. Source: CryptoQuant CryptoQuant projects that altcoins, given their increased inflow activity, could face relatively higher selling pressure compared to BTC and ETH. Meanwhile, the balance of stablecoins on exchanges—a key indicator of potential buying pressure—has increased significantly. The report notes that the exchange USDT balance, around $273 million in April, grew to $379 million by August 31, marking a new yearly high. CryptoQuant interprets this surge as a reflection of…
Share
BitcoinEthereumNews2025/09/18 01:01
Strategy Makes Biggest Bitcoin Bet In Months With $2.13B Buy

Strategy Makes Biggest Bitcoin Bet In Months With $2.13B Buy

The post Strategy Makes Biggest Bitcoin Bet In Months With $2.13B Buy appeared on BitcoinEthereumNews.com. Strategy Makes Biggest Bitcoin Bet In Months
Share
BitcoinEthereumNews2026/01/21 15:07