

Cardano crypto price: ADA at a key $0.25–0.26 support zone in a bearish regime

Market conditions remain tense as the Cardano crypto price hovers near a crucial support area while broader sentiment is locked in extreme fear.
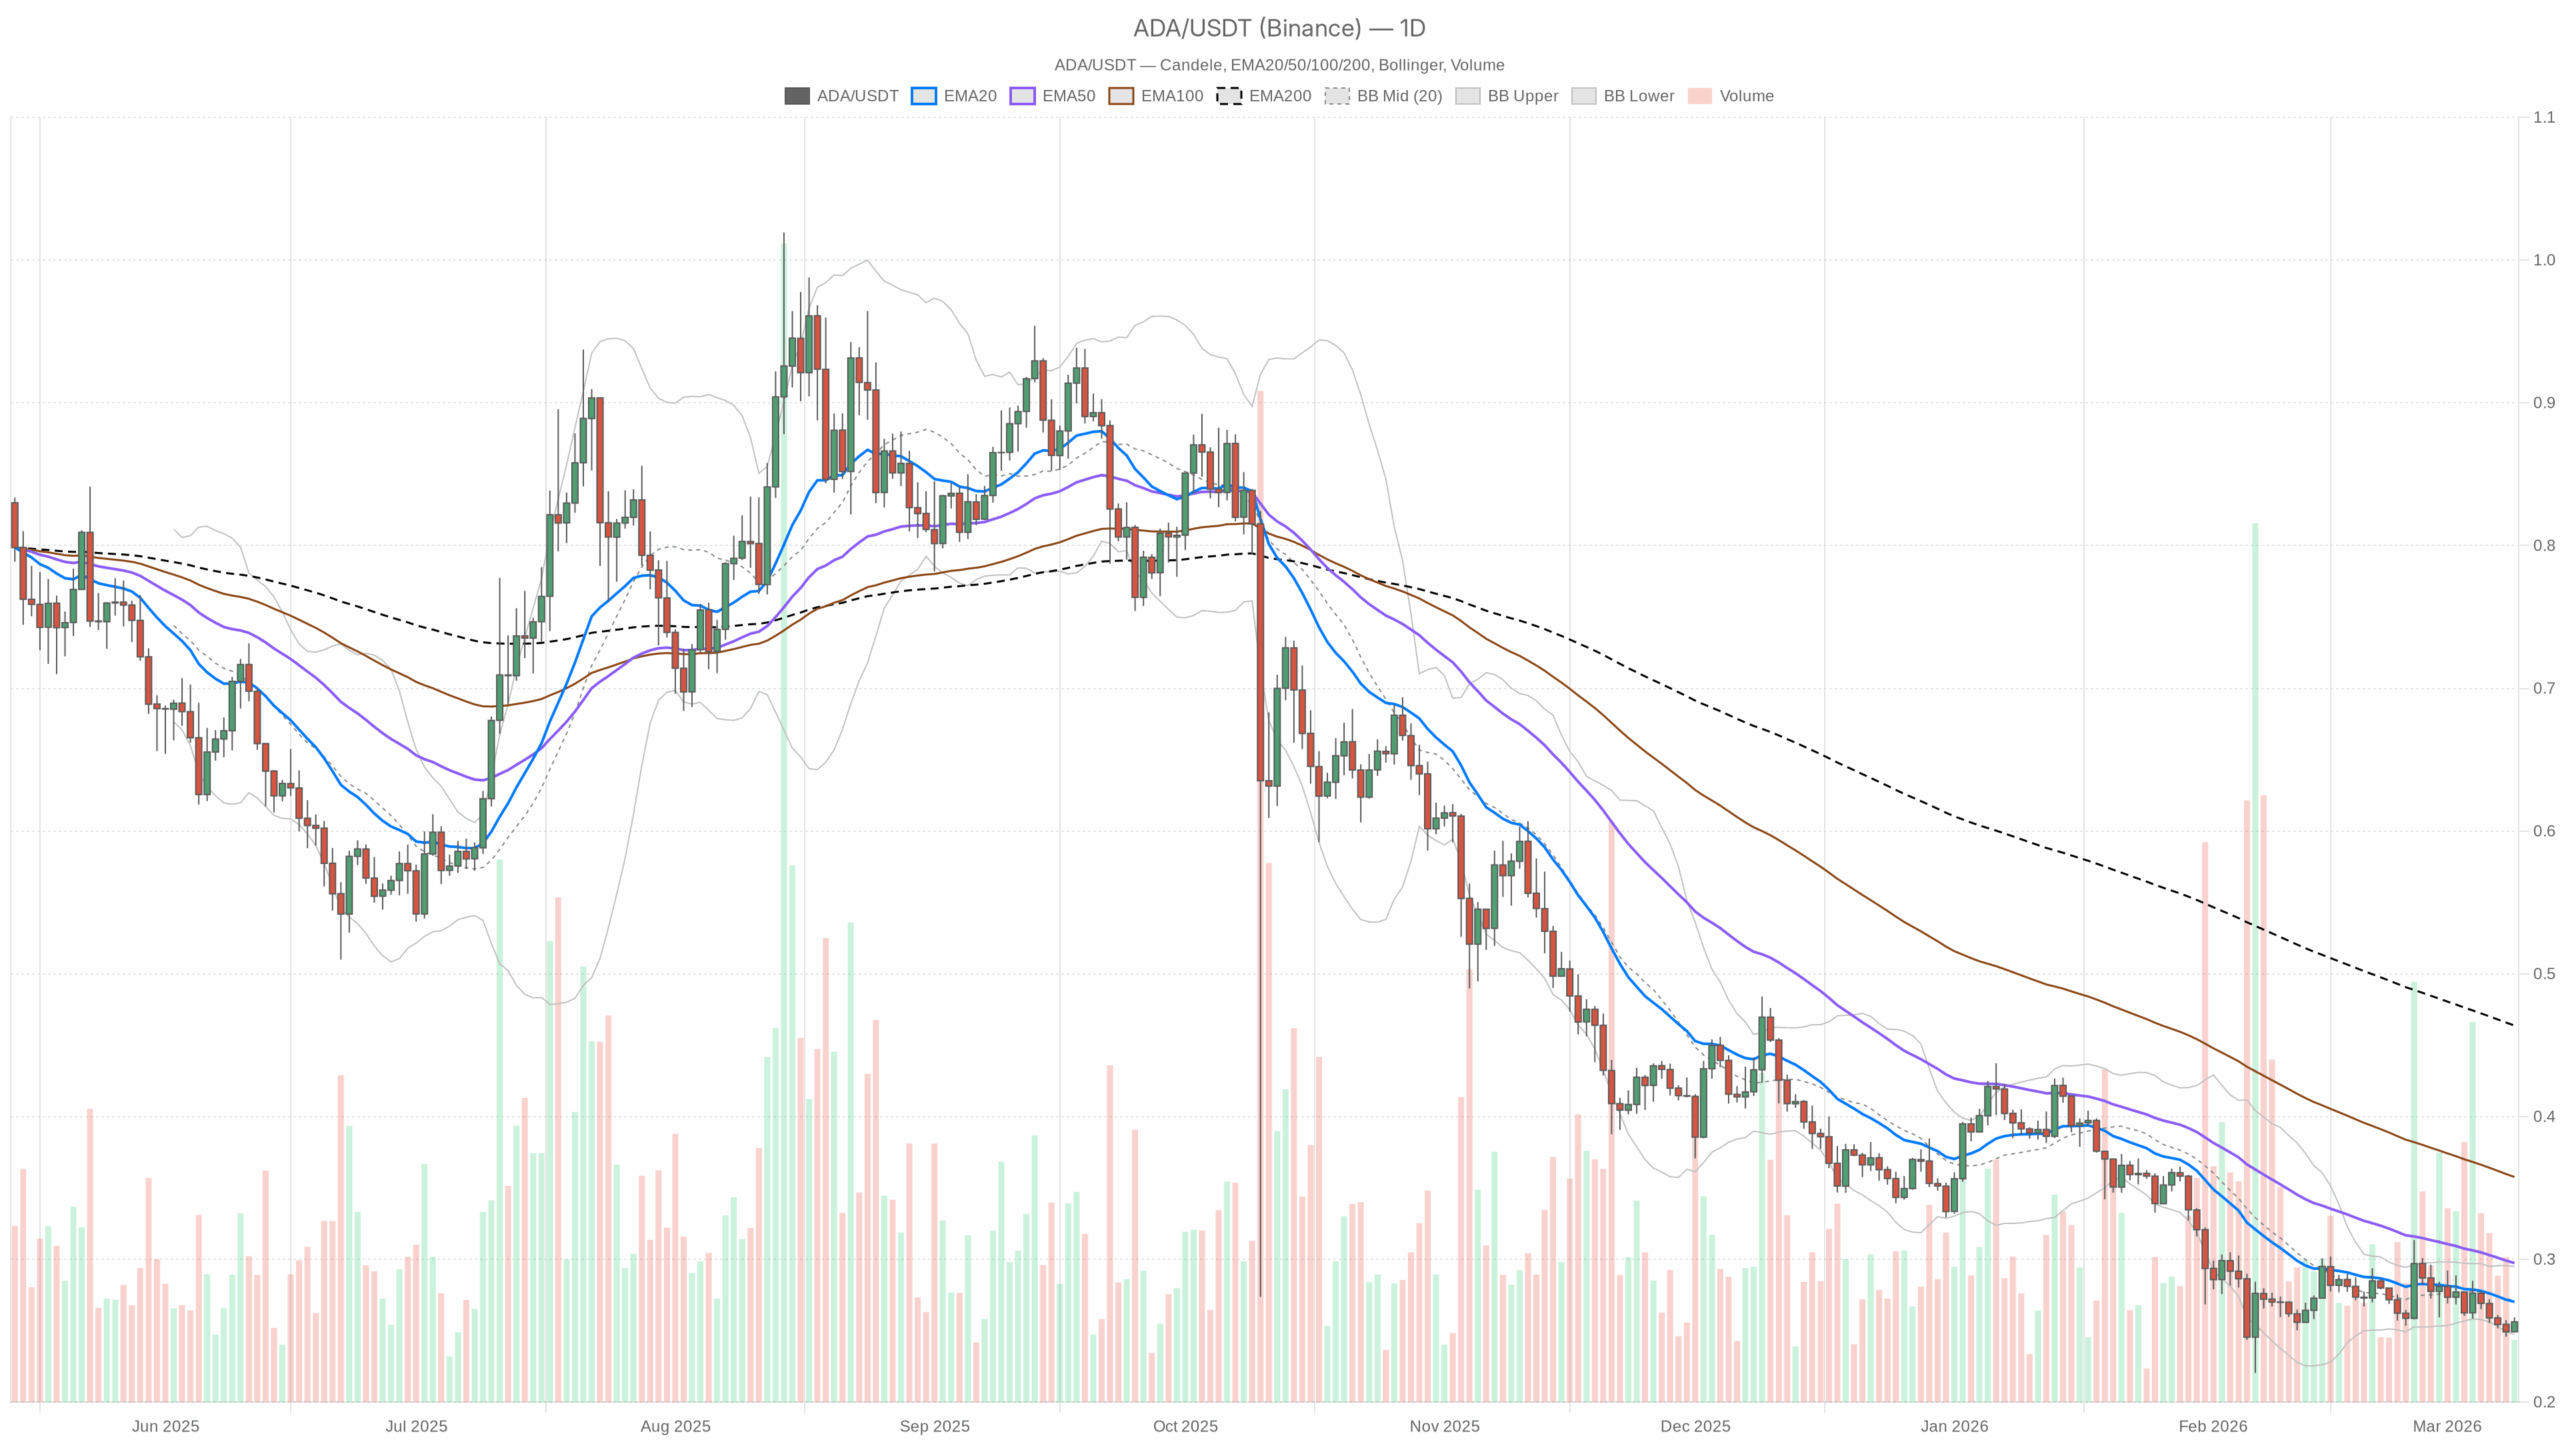 ADA/USDT — daily chart with candlesticks, EMA20/EMA50 and volume.
Cardano (ADAUSDT) Price: Bearish Structure, Short-Term Relief Bid
Cardano’s price against USDT is trading around $0.26, stuck in a classic bear-market grind. The daily structure is clearly bearish, but the market is trying to stabilize at the lower edge of its recent range while broader sentiment is in extreme fear. That mix often produces sharp counter-trend bounces, but so far, ADA looks more like it is consolidating in a downtrend than preparing for a major reversal.
Bitcoin dominance is high (around 56.5%), and the total crypto market cap is basically flat on the day, with volume up sharply. Moreover, money is defensive and selective; this is not an environment where lagging altcoins like ADA typically lead. For Cardano to do more than just bounce, it will need to reclaim key levels and prove it can attract risk-on flows away from Bitcoin.
On the higher timeframe, the main scenario is bearish. The lower timeframes (H1 and M15) show a modest, short-term bid, but it is counter-trend so far.
Daily Chart (D1) – Macro Bias: Bearish with Possible Base Around $0.25–0.26
Trend & EMAs
– Price (close): $0.26
– 20-day EMA: $0.27
– 50-day EMA: $0.30
– 200-day EMA: $0.46
– Regime flag: bearish
ADA is trading below all major EMAs. The 20-day sits above price at $0.27, the 50-day is further up at $0.30, and the 200-day is way above at $0.46. That is a textbook downtrend alignment: short-, medium-, and long-term averages all stacked above price.
Implication: The dominant force is the sellers. Any rally into $0.27–0.30 is structurally a sell-the-rip area unless ADA can break and hold above those EMAs.
RSI (14)
– RSI: ~42
RSI in the low 40s shows weak but not oversold momentum. Bears are in control, but the move down is not currently in a panic phase.
Implication: There is room both for another leg down (without oversold protection) and for a bounce. RSI is not extreme enough to call a capitulation low or a strong mean-reversion setup yet.
MACD
– MACD line: -0.01
– Signal line: -0.01
– Histogram: 0
Both lines are slightly negative and basically flat, with the histogram at zero. Momentum to the downside has cooled off, but there is no clear bullish cross with strong follow-through either.
Implication: The downtrend is losing energy, but buyers have not seized control. This often precedes either a sideways grind at the lows or a slow basing pattern, not an immediate trend reversal.
Bollinger Bands (20, 2)
– Middle band (20-SMA proxy): $0.27
– Upper band: $0.30
– Lower band: $0.25
– Price: $0.26, hovering just above the lower band
Price is sitting in the lower half of the band range, not pinned to the bottom but clearly closer to support than resistance.
Implication: The recent push lower has eased. ADA is in a potential accumulation or pause zone near the lower band. If price climbs back above the mid-band ($0.27) and holds, that would hint at a short-term mean-reversion bounce toward $0.30. However, failure to hold above $0.25 opens the door to a fresh leg down along the lower band.
ATR (14)
– ATR (daily): $0.02
Daily volatility sits at about two cents, modest relative to the $0.26 price.
Implication: Swings are contained. Right now, ADA is not in a high-volatility capitulation or breakout phase; it is more like a controlled drift lower with occasional small bounces.
Daily Pivot Levels
– Pivot point (PP): $0.25
– First resistance (R1): $0.26
– First support (S1): $0.25
Price at $0.26 is pressing right against R1, with the pivot and S1 clustered around $0.25.
Implication: The $0.25–0.26 band is a decision zone. Holding above $0.25 keeps a short-term base alive; losing $0.25 would confirm that bears are still in full control on the daily timeframe.
1H Chart – Counter-Trend Bounce Inside a Bearish Daily Context
Trend & EMAs (H1)
– Price: $0.26
– 20-EMA: $0.25
– 50-EMA: $0.25
– 200-EMA: $0.26
– Regime flag: neutral
On the hourly, price is now above the 20 and 50 EMAs and roughly at the 200 EMA. That is a short-term recovery off the lows but still sitting under longer-term resistance when we zoom out to the daily.
Implication: Bulls have the ball in the very short term, but they are driving straight into higher-timeframe resistance. It is a classic counter-trend rally setup.
RSI (14, H1)
– RSI: ~56
Hourly RSI slightly above 50 signals mild bullish intraday momentum.
Implication: Intraday buyers are in control for now, but the reading is not stretched; this is a controlled bounce, not a euphoric spike.
MACD (H1)
– MACD line: 0
– Signal line: 0
– Histogram: 0
MACD is sitting dead flat near the zero line.
Implication: Momentum is indecisive on the hourly chart. Price is drifting up, but without a strong thrust. That fits with a cautious market still in price discovery around this $0.25–0.26 support area.
Bollinger Bands (H1)
– Middle band: $0.25
– Upper band: $0.26
– Lower band: $0.25
– Price: $0.26, near the upper band
On the hourly, ADA is hugging the upper band.
Implication: In the short run, buyers are pressing price higher within the band range. If ADA starts closing repeatedly above the mid-band while the upper band lifts, the intraday trend could extend higher toward the daily mid-band ($0.27).
ATR (H1)
– ATR: 0 (very low reading)
The reported hourly ATR is effectively zero, which in practice means volatility has compressed heavily on this timeframe.
Implication: Hourly price action is in a tight consolidation. Such compressions usually precede a larger move; the direction will likely follow the higher-timeframe bias unless a strong catalyst appears.
Hourly Pivot Levels
– Pivot point (PP): $0.26
– R1: $0.26
– S1: $0.25
Price is hovering at the hourly pivot/R1 cluster around $0.26, with support at $0.25.
Implication: As long as ADA holds above $0.25 on the hourly, intraday traders will keep leaning slightly long. A clean break back below $0.25 would flip the short-term tone back in favor of the daily downtrend.
15m Chart – Execution Zone Inside a Tight Range
Trend & EMAs (M15)
– Price: $0.26
– 20-EMA: $0.26
– 50-EMA: $0.25
– 200-EMA: $0.25
– Regime flag: neutral
On the 15-minute chart, price is riding the 20-EMA, with the 50 and 200 just below.
Implication: Very short-term structure is slightly bullish but range-bound. It is more of a micro-uptrend inside a larger sideways band.
RSI (14, M15)
– RSI: ~54
RSI is modestly above 50.
Implication: Short-term buyers have the edge, but there is no sign of exhaustion or aggressive buying yet. It is orderly, not explosive.
MACD (M15)
– MACD line: 0
– Signal line: 0
– Histogram: 0
Again, MACD is flat.
Implication: Intrabar momentum is muted. Most of the current action is micro-range trading around $0.26, with no clear push either way.
Bollinger Bands (M15)
– Middle band: $0.26
– Upper band: $0.26
– Lower band: $0.25
– Price: $0.26
Price is oscillating around the middle to upper part of the local band.
Implication: Short-term volatility is compressed and directionless. This timeframe mainly tells you execution detail, not a strong directional edge.
15m Pivot Levels
– Pivot point (PP): $0.26
– R1: $0.26
– S1: $0.26
The pivots are tightly clustered around current price.
Implication: ADA is parked at equilibrium intraday. Scalpers are likely fading small moves rather than chasing trends.
Market Sentiment & On-Chain/DeFi Context
The crypto Fear & Greed Index is at 8 – Extreme Fear. Historically, such readings can coincide with medium-term buying opportunities, but they can also persist in entrenched bear markets.
On Cardano’s DeFi side, the major DEXs (Minswap, WingRiders, SundaeSwap, Splash) show huge 30-day fee declines (roughly -70% to -90%), even if some have a short-term bump in daily fees.
Implication: Activity on Cardano is under pressure. Structural demand for ADA from DeFi is not strong right now, which aligns with the bearish higher-timeframe price structure. Any rally without a pickup in real usage is more likely to be a trading bounce than the start of a sustained bull leg.
Main Scenario for ADAUSDT: Bearish, With Room for Counter-Trend Bounces
Putting it all together:
– Daily timeframe: Clear downtrend, price below all major EMAs, RSI sub-50, MACD negative but flattening.
– Intraday (H1/M15): Mild upward bias, low volatility, price consolidating near local resistance ($0.26), with support around $0.25.
– Macro sentiment: Extreme fear, high BTC dominance, ADA DeFi activity weak.
The dominant force is still bearish on the daily. The lower timeframes show a short-term relief bid, but it is operating against the higher-timeframe trend. In this context, the Cardano crypto prezzo level around $0.25–0.26 becomes a crucial battleground between buyers and sellers.
Bulish Scenario for Cardano (ADAUSDT)
In a constructive path, ADA turns this $0.25–0.26 band into a genuine base rather than a pause before further downside.
Key steps bulls need:
1. Reclaim and hold above $0.27 (daily mid-band and roughly the 20-day EMA). That would tell us price is starting to mean-revert instead of bleeding lower.
2. Push toward $0.30 (confluence of daily upper Bollinger band and 50-day EMA). This zone is the first serious test of whether sellers are still waiting to unload.
3. On indicators, you would want to see RSI back above 50 on the daily and the MACD line curling up through the signal line from below with a positive histogram.
If this plays out, the near-term upside window is roughly $0.30, with an extended target toward $0.35–0.38 only if price can sustain closes above $0.30 and drag the 20- and 50-day EMAs upward.
What invalidates the bullish scenario?
– A decisive daily close below $0.25 with expanding ATR and a push in RSI back toward the mid-30s or lower. That would show the base has failed and sellers have regained full control.
Bearish Scenario for Cardano (ADAUSDT)
The bearish case is simply an extension of the existing daily downtrend.
How it could unfold:
1. Price fails to get above $0.27 and repeatedly gets sold near $0.26–0.27.
2. Intraday structure (H1/M15) rolls over, with price losing $0.25 and EMAs on those timeframes flipping back above price.
3. Daily RSI drifts back below 40 and MACD turns more negative again, confirming renewed downside momentum.
In that case, once $0.25 gives way on a daily closing basis, the market will start probing for a lower support zone. Without hard levels in the data, the next meaningful area would likely be defined by prior swing lows on the chart. From a structural standpoint, the downside risk expands beyond the current $0.02 daily ATR once that floor breaks.
What invalidates the bearish scenario?
– A clean reclaim of $0.30 on the daily, with sustained closes above the 50-day EMA and RSI holding above 50. That would mark a shift from a downtrend to at least a neutral or emerging uptrend.
Neutral / Range Scenario
There is also a realistic middle path: ADA simply ranges between $0.25 and $0.30 for a while.
In this setup:
– Daily RSI oscillates in the 40–55 band.
– MACD stays flat around zero.
– Bollinger Bands slowly contract as volatility bleeds out.
Implication: Mean-reversion trades dominate: buy near $0.25, sell near $0.29–0.30, without a decisive breakout. This kind of environment frustrates both bulls and bears waiting for trend continuation.
This neutral scenario would be invalidated by a clear daily close outside the $0.25–0.30 range with rising ATR.
Positioning, Risk, and Uncertainty
From a trading standpoint, the picture is:
– The higher timeframe is still against ADA (bearish daily trend).
– Lower timeframes show a controlled bounce off local support with compressed volatility.
– Market sentiment is deeply fearful, and Cardano’s own DeFi activity is under pressure.
That combination usually favors short-term, tactical trading over aggressive directional bets. Trend followers will be more comfortable staying cautious or fading rallies while price remains below $0.27–0.30. Mean-reversion traders will eye the $0.25 area as a potential short-term long entry, but only with tight risk controls in case support breaks.
Moreover, volatility is currently subdued, which can change quickly, especially with fear already extreme. Any sharp expansion in ATR alongside a break of $0.25 or a squeeze above $0.30 would likely mark the start of the next meaningful leg.
In short, Cardano’s crypto price (ADAUSDT) is in a bearish regime, trying to stabilize at $0.25–0.26. Until the daily chart proves otherwise, rallies are counter-trend, and risk should be sized with that in mind.
You May Also Like

SRx Health Solutions Launches EventHorizonIQ Subscription for Individual and Institutional Traders

Pi Network Pioneers Urged to Complete V20.2 Protocol Upgrade by March 12
    Pi Network Pioneers Urged to Complete V20.2 Protocol Upgrade by March 12
    As Pi Network continues to grow a
