

Bitcoin Price News: BTC Has Played This Current Playbook Twice – and They Ended Badly
Bitcoin price action this week has started to feel familiar, and not in a comforting way. BTC price has spent months moving sideways after a sharp drop from its peak, and the structure now looks strikingly similar to patterns seen in past cycles that ended with deeper corrections before any real recovery began.
That similarity has caught attention because Bitcoin price tends to repeat behavior when market psychology follows the same path. The current phase appears to sit right in the middle of that pattern.
Bitcoin Price Pattern Mirrors Previous Cycle Setups That Led To Deeper Corrections
The pattern was pointed out by Degen Mike, who compared the current Bitcoin price structure with what happened in 2017 and 2021.
In both of those cycles, Bitcoin price broke to a new all-time high, saw a sharp correction, then moved into a confusing fakeout phase before finally forming a bottom. That fakeout stage usually creates uncertainty because price appears stable for a while yet fails to confirm a true recovery.
Bitcoin followed that exact sequence again since 2025. BTC price reached a new all-time high near $126,000 in October, then dropped aggressively toward $60,000. Price has since moved sideways between $60,000 and $75,000 since February, which fits the same fakeout structure seen before.
This matters because previous cycles did not bottom during that phase. Lower lows came afterward before the next major move began.
Bitcoin Price Faces Key Support Test That Could Decide The Next Direction
Another perspective from More Crypto Online adds more detail to the current situation. Their analysis points to the 78.6% Fibonacci retracement level near $74,968 as a key support area.
A look at the BTC chart shows that this level has already been tested. Price reacted around that zone, which keeps a recovery scenario possible. A strong hold above that level could allow Bitcoin price to stabilize before attempting another move higher.
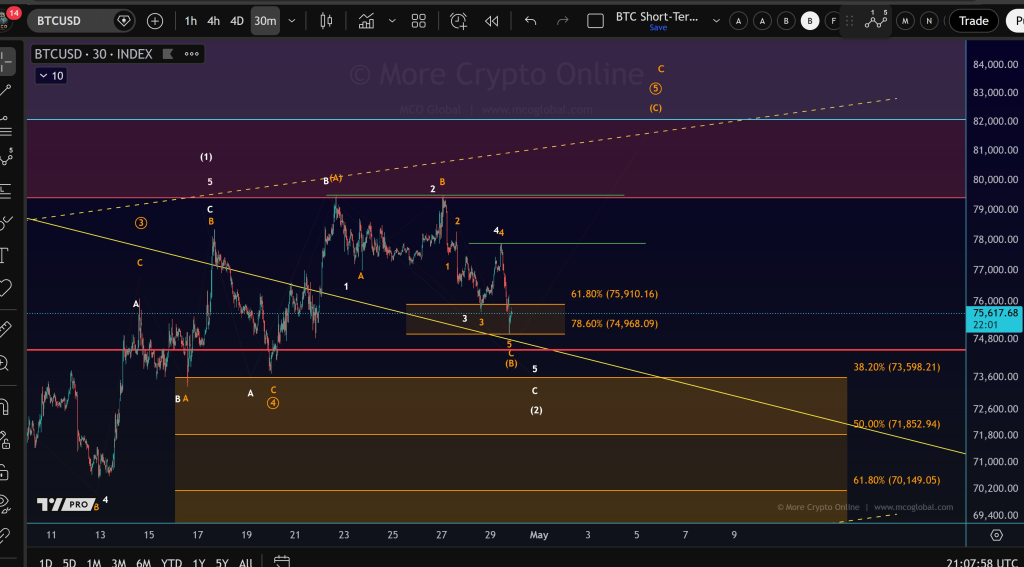 @Morecryptoonl / X
A decisive break below that level would change the outlook quickly. It would shift the probability toward a deeper correction scenario, which aligns with the broader fakeout pattern discussed earlier.
Both views point to the same conclusion. Bitcoin price has not confirmed a bottom yet, and the structure still allows for further downside.
ETF Outflows Add Pressure To Bitcoin Price In The Short Term
Recent ETF data adds pressure to the BTC price outlook. Data shared by Wu Blockchain shows that on April 29, U.S. spot Bitcoin ETFs recorded net outflows of $138 million.
That figure signals that institutional demand slowed during that session. Spot Ethereum ETFs also saw outflows, which suggests that capital moved away from crypto exposure more broadly.
ETF flows have become one of the most important drivers of Bitcoin price in recent years. Continued outflows could weaken support levels and increase the chance of a deeper pullback if buying interest does not return quickly.
Bitcoin Price Structure Shows Clear Support And Resistance Levels
The current BTC price structure reveals well-defined zones that traders are watching closely. Strong support sits between $62,000 and $65,000. Another major support range exists between $50,000 and $54,000.
Resistance remains firm between $79,000 and $83,000, with a higher resistance band between $95,000 and $99,000.
Bitcoin price trades around $76,000 at the moment. That position places it below a critical resistance zone. A move toward $100,000 cannot be confirmed unless BTC price breaks above $83,000 and holds that level.
Failure to break resistance increases the likelihood of continued range movement. That range has already been visible for months between $60,000 and $79,000.
A break below $60,000 would change the structure entirely. That move could open the path toward the $50,000 region within a short period.
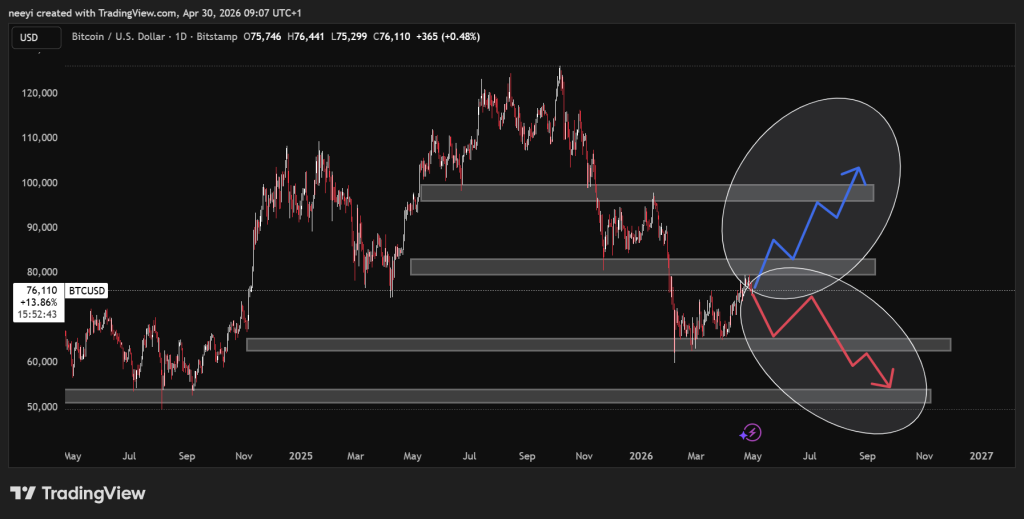 BTC Price Chart / TradingView.com
Bitcoin Price Scenarios Show Three Possible Paths From Here
The neutral scenario remains the most straightforward. Bitcoin price continues to move between $60,000 and $79,000, with occasional moves slightly into the low $80,000 region. This would extend the current consolidation phase without confirming a clear trend.
The bearish scenario becomes active if ETF outflows continue and BTC price loses the $60,000 level. A confirmed break and retest of that level as resistance would signal a stronger downtrend. That situation could push Bitcoin price toward $50,000.
The bullish scenario requires a clean break above the $84,000 region. That move would shift momentum and open the door for a push toward $100,000 in the weeks that follow.
Read Also: Why Is Gold Price Falling?
Broader Market Factors Continue To Shape Bitcoin Price Direction In 2026
Several major factors continue to influence Bitcoin price this year. Regulatory developments such as the Digital Asset Market Structure Clarity Act could unlock new institutional capital if passed.
ETF inflows and outflows remain a daily driver of price movement. Geopolitical tensions, especially involving the United States and Iran, continue to affect global markets and risk assets.
The implementation of the GENIUS Act is expected to accelerate stablecoin use and financial integration. Bitcoin’s supply dynamics also changed after the 20 millionth coin was mined in March 2026, which reduced inflation below that of gold.
Institutional adoption continues to evolve, although corporate treasury accumulation has slowed compared to previous years. That places more weight on ETF demand as the primary driver.
FAQs
Subscribe to our YouTube channel for daily crypto updates, market insights, and expert analysis.
The post Bitcoin Price News: BTC Has Played This Current Playbook Twice – and They Ended Badly appeared first on CaptainAltcoin.


You May Also Like

USD/JPY retreats from multi-month high as Japan’s warnings cap upside

Can hyperliquid onchain and Bitget Wallet bring Wall Street markets to DeFi?
