

MRVL stock stalls near earnings as momentum fades at the upper band

MRVL stock remains in a dominant daily uptrend, but momentum is pausing near the upper Bollinger band into earnings. With a close at 184.18 just below 184.53, the setup favors digestion over a clean breakout today.
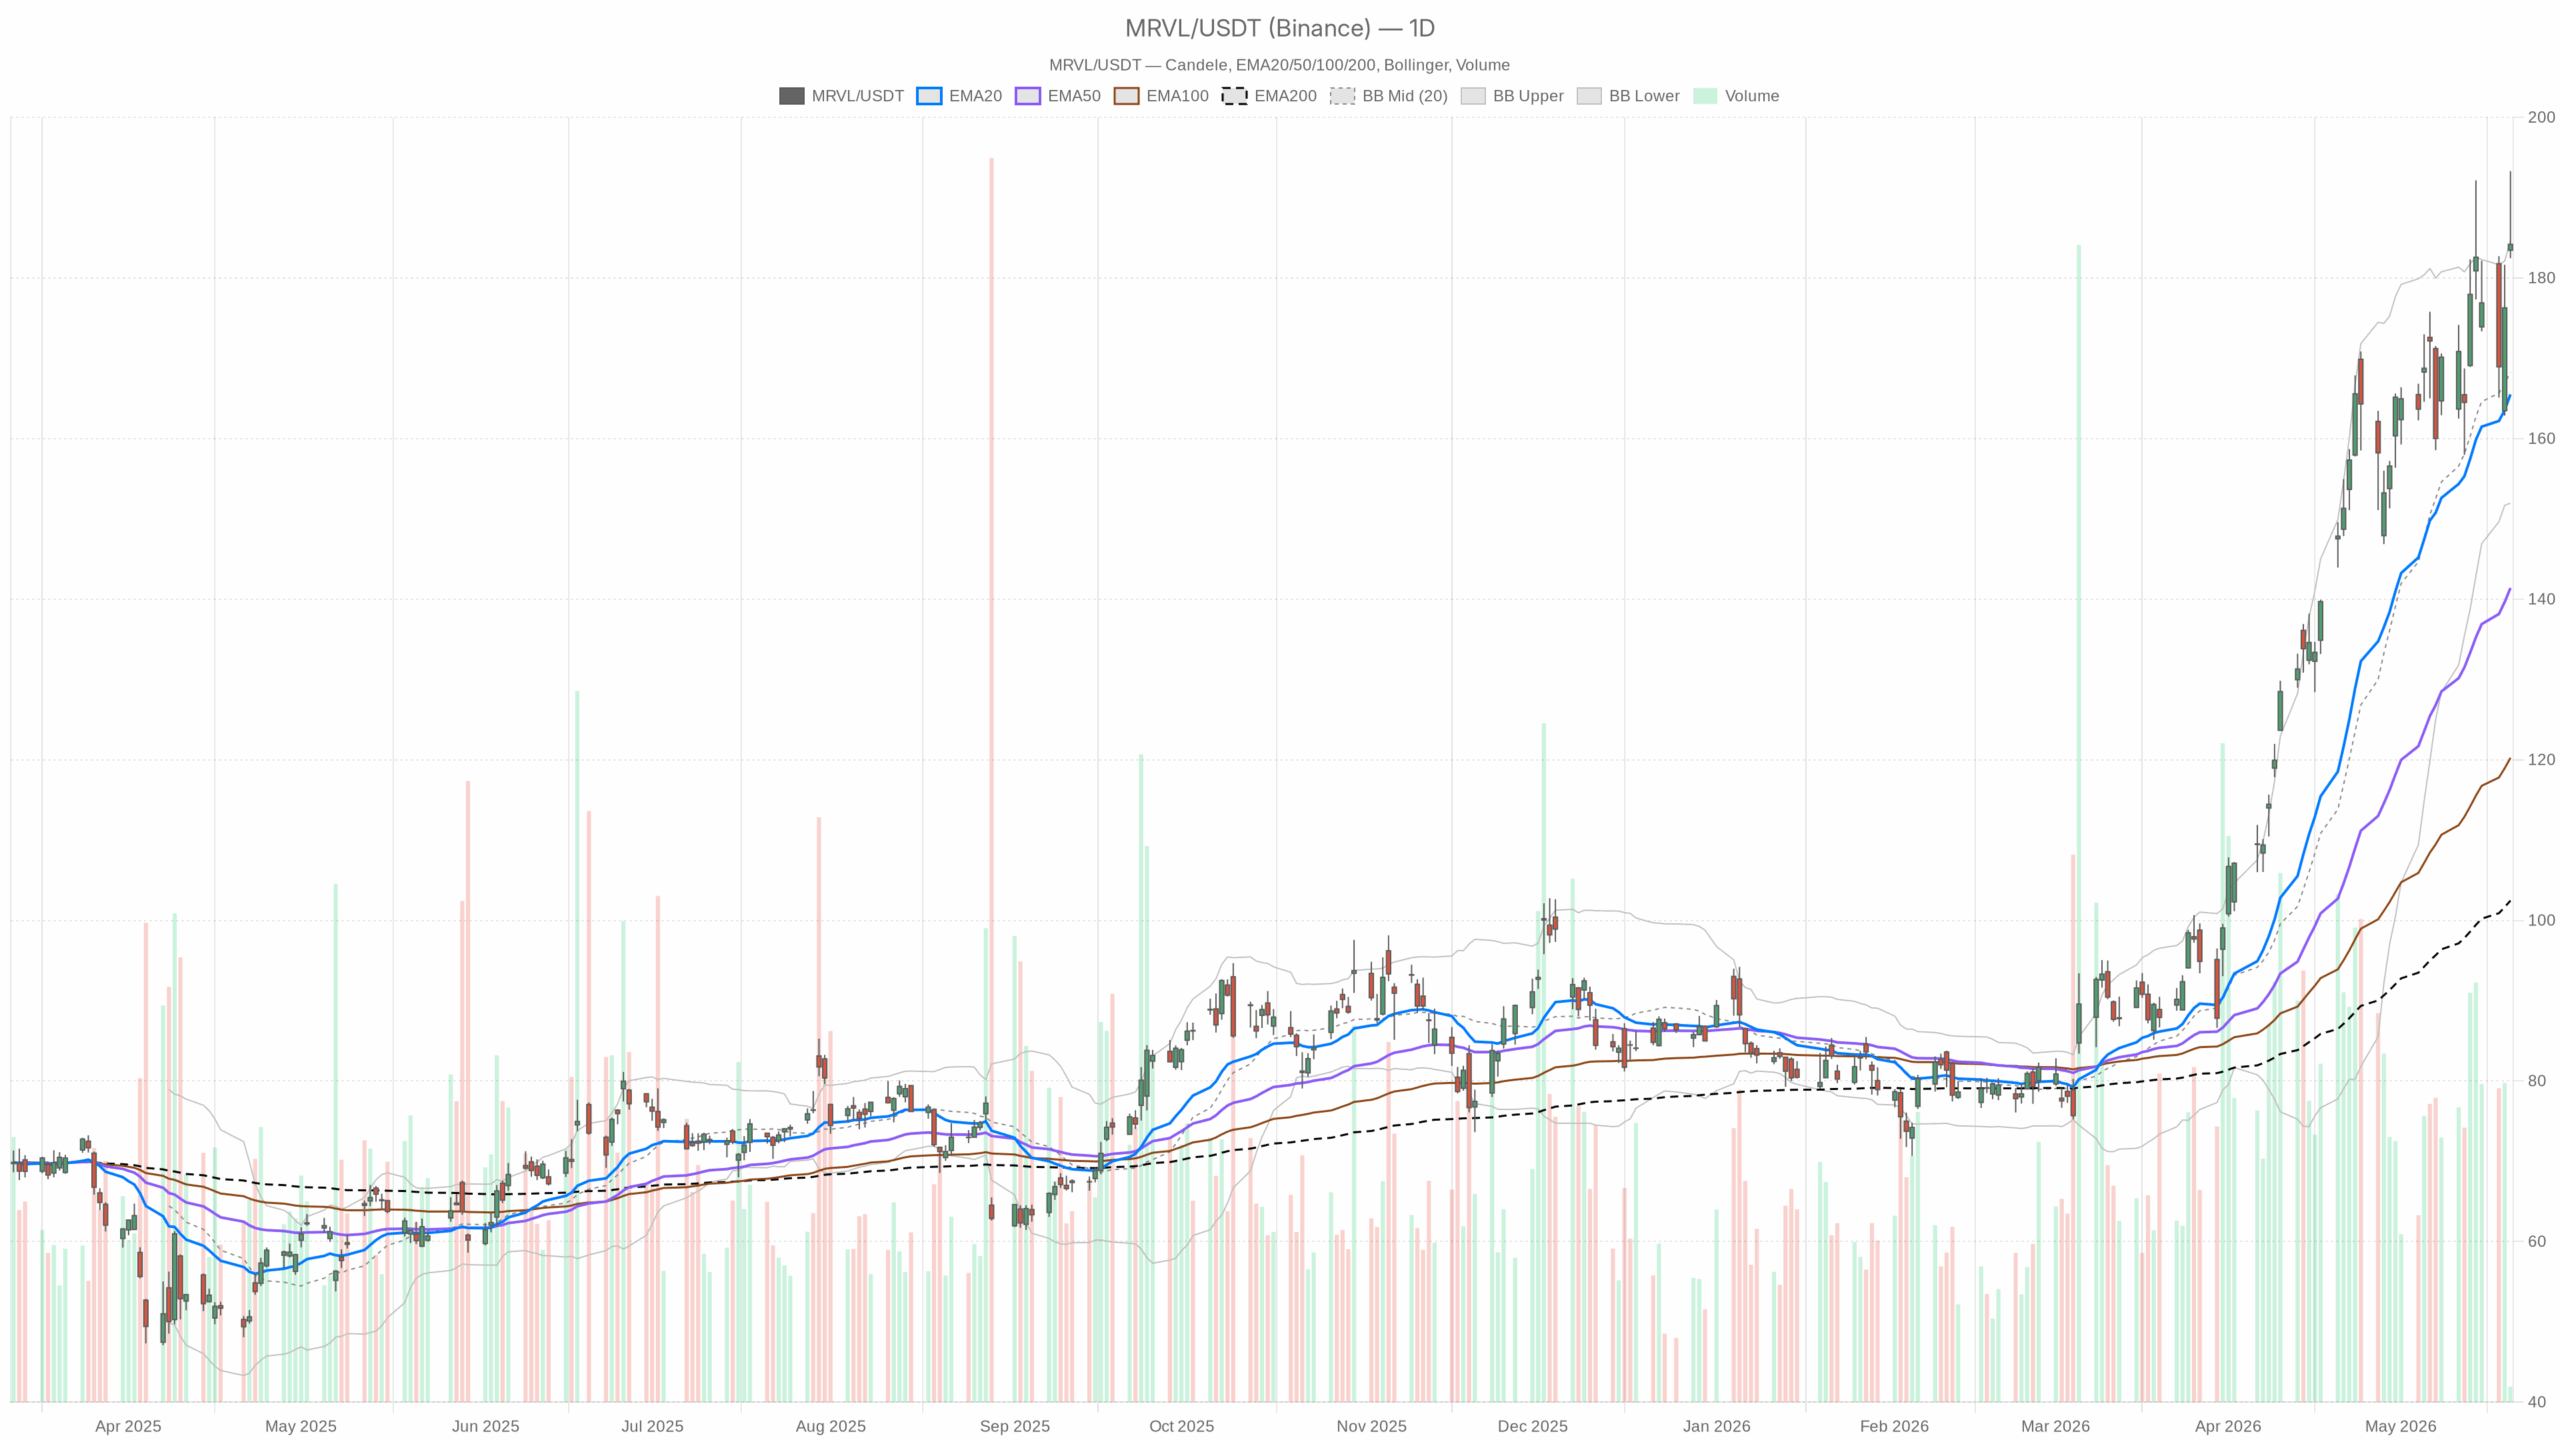 MRVL — daily chart with candlesticks, EMA20/EMA50 and volume.
Daily trend and momentum: MRVL stock near the upper band
Trend structure — EMAs aligned
On trend, the daily EMAs are strongly aligned. EMA20 165.5, EMA50 141.39, and EMA200 102.46 all sit well below price and are rising. This positive stack confirms a durable uptrend and keeps buyers in control on the 1D frame.
Momentum gauges — RSI and MACD
The daily RSI14 66.49 signals firm upside without overbought conditions. However, the MACD line 12.43 sits below its signal 13.36, and the histogram is -0.93, indicating a mild loss of impulse on the daily tape.
Volatility and pivot map
Notably, the daily ATR14 12.56 implies wide ranges. Meanwhile, price is below the daily pivot at 186.65, with R1 190.83 and S1 179.99. Trading under the pivot points to supply near current levels, while S1 marks the first meaningful downside cushion.
1H chart: intraday structure backs the bullish bias
Trend and momentum
Price at 184.17 holds above the 1H EMA20 178.56, EMA50 175.1, and EMA200 156.78. The 1H RSI14 58.41 looks healthy, and the MACD histogram is +1.45 with the line at 2.83 above the 1.39 signal. Intraday momentum has turned positive.
Pivots, bands, and volatility
At the same time, price is hovering around the 1H pivot at 184.21, with R1 184.79 and S1 183.6. A tight balance near the pivot often precedes a directional push. The 1H Bollinger mid is 175.46 and the upper band is 190.56, while ATR14 5.33 flags meaningful intraday volatility.
15-minute execution layer: neutral to slightly heavy
Meanwhile, price is marginally below the 15m EMA20 184.47 and sits on the 15m pivot at 184.23. Short‑term sellers are probing, but control is not decisive.
The 15m MACD histogram is -0.86 with the line below the signal, and RSI14 52.63 is flat. In addition, the 15m Bollinger mid at 184.8 caps near-term price, while ATR14 3.16 warns of quick whipsaws.
Price structure and range dynamics
From a price-structure standpoint, MRVL rejected an intraday high of 193.3 and closed near 184.18 on the daily bar. That was a fade from highs, yet it remains within a strong uptrend.
In contrast, holding well above the daily EMA20 165.5 keeps higher lows intact and preserves the primary trend. Trend support remains far below, so pullbacks would need to be deep to damage structure. Overall, this reads as an uptrend catching its breath near resistance.
Fundamental headlines and sentiment backdrop for MRVL stock
Evercore ISI raised its MRVL price target to 155 on rising AI infrastructure demand. This sell‑side catch‑up underscores the structural theme, even if the target trails spot.
Seeking Alpha commentary flagged optimism ahead of Q1 2027 earnings and cited Nvidia’s $2B stake alongside constructive guidance. Institutional sponsorship and guidance strength align with the technical trend.
Furthermore, MRVL has surged 179% over the past year and roughly 95% year to date, per recent coverage. On the other hand, a separate piece argued the “easy money is gone,” reminding traders to expect two‑way risk at elevated levels.
Bullish scenario: triggers and targets for MRVL stock
Therefore, the bullish path hinges on clearing and holding above the daily pivot at 186.65. If achieved, attention shifts to daily R1 190.83 as the first upside waypoint. The daily Bollinger upper band near 184.53 could also expand with trend, validating renewed energy. On 1H, maintaining a positive MACD histogram and nudging RSI toward 60+ would confirm follow‑through. On 15m, flipping back above the EMA20 184.47 and R1 184.5 offers a quick‑tell for execution.
Bearish or corrective scenario: risks and levels
At the same time, the bearish or corrective scenario builds if MRVL fails to reclaim 186.65 and instead breaks below daily S1 179.99. Losing S1 would open room toward mean reversion. A deeper pullback toward the daily EMA20 165.5 would then be plausible in volatility.
In this case, watch 1H performance around S1 183.6 and the pivot at 184.21. Sustained trading below both would indicate intraday supply in control. Notably, further deterioration in the daily MACD histogram from -0.93, while RSI rolls over from 66.49, would confirm fading momentum.
Strategy considerations and bottom line for MRVL stock
Risk, momentum, and volatility are finely balanced here. The daily uptrend is intact, yet price sits near the upper band and just under key pivots. Meanwhile, intraday tools lean supportive and the 15m is indecisive. Therefore, positioning near 184 should respect elevated ATRs on the daily and hourly frames, and allow for headline sensitivity into earnings‑related chatter.
Bottom line: MRVL’s primary bias is bullish on the daily timeframe, confirmed by a constructive 1H, but with a short‑term stall on 15m around the 184 pivot. A decisive push above 186.65 would likely re‑ignite trend extension toward 190.83, while failure and a slip below 179.99 would shift focus to mean reversion. Overall, upside still leads, yet volatility and crowded sentiment argue for tactical discipline.


You May Also Like

Red flag raised over alleged GOP effort to boost controversial Dem's candidacy

BNB Price Prediction: ETF Momentum Meets Bullish Compression With $680 Breakout Looming

Bitcoin Market Increasingly Relies on MicroStrategy as Institutional Demand Shifts, Wu Blockchain Reports


