

Why PepsiCo Stock at $146 Looks Mispriced After Its Q1 2026 Operating Income Recovery
Key Takeaways for PepsiCo Stock
- PepsiCo reported Q1 2026 revenue of $19.44 billion, an 8.5% increase year-over-year.
- Operating income grew to $3.30 billion in Q1 2026, up from $2.83 billion in Q1 2025 while operating margins expanded to 17% in Q1 2026, recovering from a trough of 11% in Q4 2024.
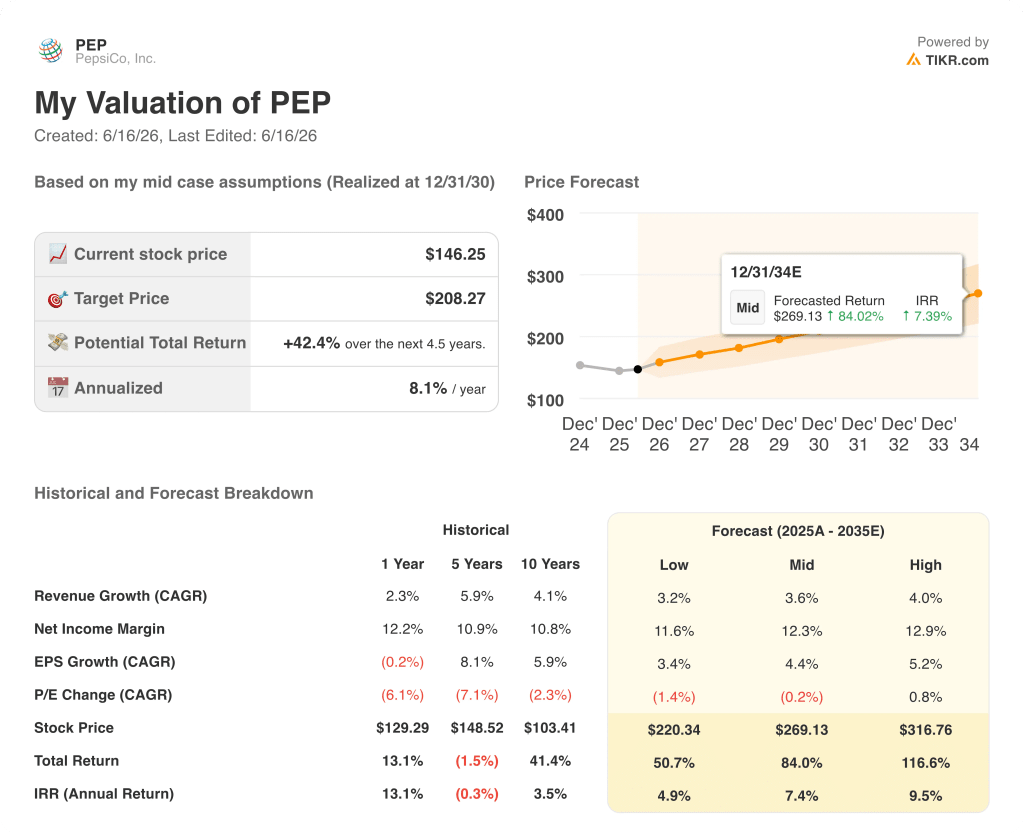
- TIKR’s model values PepsiCo at approximately $208 by December 2030, implying around 42% total return from the current price.
If PepsiCo’s margin recovery is still in early innings, you’ll want to see the full historical trend — not just one quarter. Explore PepsiCo stock data on TIKR for free →
PepsiCo Beats Q1 2026 Revenue Estimates as North America Foods Volume Inflects
 PEP Stock Q1 2026 Earnings in USD (TIKR)
PepsiCo, Inc. (PEP) posted Q1 2026 revenue of $19.44 billion following earnings on April 21, 2026, beating Wall Street’s estimate of $18.94 billion as the company’s North America Foods turnaround showed its first clear volume recovery.
PepsiCo is one of the world’s largest food and beverage companies, operating snack brands like Lay’s, Doritos, and Tostitos under its Frito-Lay North America (PFNA) segment alongside beverage brands in its PepsiCo Beverages North America (PBNA) unit.
The most undeniable data point from the quarter was volume: PFNA grew unit volume 2%, translating to 300 million more consumption occasions versus Q1 2025.
CEO Ramon Laguarta explained the breadth of the recovery during the Q1 earnings call: “When you see the 2% volume growth is a combination of all these elements — more value in some of the core brands, multipacks and multiserve is one lever, but it’s a much more holistic.”
The recovery was supported by brand restaging, expanded shelf space from retail partners, and innovation in permissible snacking, with brands like SunChips, Smartfood, and Siete delivering double-digit growth.
PBNA added another growth vector: the segment grew total reported revenue 9%, driven by both organic growth and the addition of acquired platforms including poppi, as well as expanded energy drink distribution through CELSIUS.
Management affirmed full-year organic revenue guidance of 2% to 4% and flagged Q2 as the point where North America distribution resets and innovation launches would be substantially complete.
The international business, cited as a key growth pillar, continued to accelerate despite the Iran conflict backdrop, with CEO Laguarta noting that PepsiCo’s supply chain redundancy was outperforming competitors in affected markets.
The volume inflection at PFNA is the kind of structural signal that takes time to surface in the income statement. Pull up the full PepsiCo financial history on TIKR for free →
PepsiCo’s Operating Margin Recovery Is Real, But the Income Statement Shows It Has Further to Go
 PEP Stock Quarterly Financials (TIKR)
PepsiCo’s revenue grew 8.5% year-over-year to $19.44 billion in Q1 2026, the strongest quarterly growth rate in eight periods.
Gross profit reached $10.75 billion in the most recent quarter, recovering from a year-ago low of $9.99 billion.
Gross margin held at 55%, stable across six of the last eight quarters and signaling that PepsiCo’s pricing architecture has not been sacrificed to buy back volume.
Operating income of $3.30 billion in Q1 2026 marks a meaningful step up from the prior-year comparable of $2.83 billion, with the year-over-year gain approaching 17%.
Operating margin expanded to 17% in the most recent quarter, recovering sharply from its trough near 11% in Q4 2024, but still below the 18% or 19% levels the business achieved in the first half of the prior fiscal year.
The distance between where operating margins are now and where they have recently been is the key tension: the gross margin floor has held, SGA came in at $7.61 billion versus $7.16 billion a year ago, and the operating income recovery is real — but the business has not yet reclaimed its prior efficiency ceiling.
Coca-Cola Holds a Structural Operating Margin Lead Over PepsiCo, GIS, and MDLZ Across Eight Quarters
 PEP Stock Operating Margins vs KO Stock, GIS Stock, and MDLZ Stock (TIKR)
Coca-Cola (KO) operated at a 35% operating margin in the most recent quarter, more than double PepsiCo’s 17% over the same period.
The KO premium has been consistent across all eight quarters shown, never falling below 27% even at its trough, while PepsiCo’s margin bottomed near 11% in Q4 2024 before recovering.
General Mills (GIS) ran a 13% operating margin in the most recent quarter, sitting below PepsiCo for the sixth consecutive period.
Mondelez (MDLZ) posted the weakest result among the four at 9% in the most recent quarter, a figure that has declined in three of the last four periods.
PepsiCo’s 17% operating margin in Q1 2026 places it second in the peer group which is above both GIS and MDLZ, but the 18-percentage-point gap versus Coca-Cola is not a cyclical anomaly; it reflects a structurally different business model, with KO operating a lighter asset, concentrate-driven model while PepsiCo carries the manufacturing and distribution costs of a direct-store-delivery snack business.
The investment implication is clear: PepsiCo stock does not need to close the gap with Coca-Cola to justify a rerating, because recovering toward the 18% to 19% operating margins the income statement showed as recently as mid-2024 would still represent meaningful improvement from today’s levels.
Is PepsiCo Stock Undervalued? TIKR’s $208 Target Says the Income Statement Makes the Case
TIKR’s model values PepsiCo at approximately $208 by December 2030, implying around 42% total return from the current price of $146, or roughly 8% per year.
 PEP Stock Valuation Model Results (TIKR)
The credibility of that target rests almost entirely on whether the operating margin recovery visible in the income statement continues from here.
The gross margin floor has proven resilient across eight quarters, which means the path to higher operating margins runs through SGA leverage as revenue scales — and Q1 2026’s 8% revenue growth is the clearest signal yet that the scaling has begun.
If operating margins close even part of the gap back toward prior peak levels, the earnings power implied by TIKR’s target becomes achievable without requiring any heroic revenue assumption.
Curious whether TIKR’s model uses conservative or aggressive margin assumptions? Build your own PepsiCo valuation on TIKR for free →
Should You Invest in PepsiCo, Inc.?
The only way to really know is to look at the numbers yourself. TIKR gives you free access to the same institutional-quality financial data that professional analysts use to answer exactly that question.
Pull up PepsiCo, Inc. stock and you’ll see years of historical financials, what Wall Street analysts expect for revenue and earnings in the quarters ahead, how valuation multiples have moved over time, and whether price targets are trending up or down.
You can build a free watchlist to track PepsiCo, Inc. alongside every other stock on your radar. No credit card required. Just the data you need to decide for yourself.
Access Professional Tools to Analyze PEP stock on TIKR for Free →


You May Also Like

Daily XRP transfer volume surpasses 500 million! What does this mean during the latest price drop?

Ethereum koers toont zeldzaam dubbel koopsignaal en richt zich op $4.550

UK Gilt Yields Spike As Burnham Win Opens Door To Oust Starmer


