Solana price is hovering near the $126 support zone after losing upside momentum, as declining volume and reduced leverage show traders stepping back. Solana wasSolana price is hovering near the $126 support zone after losing upside momentum, as declining volume and reduced leverage show traders stepping back. Solana was

Solana price loses bullish momentum — will $126 support prevent a deeper pullback?

Solana price is hovering near the $126 support zone after losing upside momentum, as declining volume and reduced leverage show traders stepping back.

Summary
  • Solana is consolidating near the $126–$128 support zone after a failed push above $145.
  • Falling spot volume and declining derivatives activity suggest reduced speculative interest, even as long-term institutional inflows and ETF demand remain supportive.
  • A firm hold above $126 could stabilize price action, while a daily close below this level risks a deeper pullback toward the $118–$120 range.

Solana was trading around $130 at the time of writing, up 1.4% on the day, though momentum appears to be cooling after a sharp rejection from higher levels.

SOL is down about 10% over the last week. During that time, prices have fluctuated between $125 and $145, indicating increased volatility around key technical levels.

Additionally, trading activity has decreased. Spot volume fell 6.8% to $5.62 billion over the previous day, indicating lower participation during the decline. According to CoinGlass data, open interest dropped 3.61% to $7.60 billion, while futures volume decreased 4.4% to $15.22 billion.

When taken as a whole, these declines indicate that traders are reducing their leverage and closing positions instead of taking on additional risk, which is a common pattern during corrective phases.

Institutional flows and on-chain activity remain constructive

Despite short-term weakness, institutional demand continues to build in the background. Spot Solana (SOL) exchange-traded funds recorded $2.92 million in net inflows on Jan. 21, as per SoSoValue data.

Monthly net inflows have now exceeded $103 million, bringing cumulative inflows to roughly $869 million.

Solana’s on-chain activity is still quite strong. According to DefiLlama data, daily decentralized exchange volume has nearly doubled since the beginning of 2026, going from about $2.5 billion to over $5.6 billion.

Despite a slight decline, the market capitalization of stablecoins is still over $14 billion, indicating strong liquidity.

Solana’s presence in real-world asset tokenization is also growing. Real world asset’s total value locked on the network has surpassed $1.1 billion, placing it third behind Ethereum and BNB Chain. This expansion continues to be fueled by institutional names such as BlackRock, Franklin Templeton, and Ondo.

At the same time, upgrades like Firedancer are improving network reliability, while regulatory clarity discussions and payments-focused partnerships support longer-term adoption.

Solana price technical analysis

From a technical standpoint, momentum has clearly rolled over. Solana failed to hold gains above the $145–$150 zone, where price was repeatedly rejected near the upper Bollinger Band. The current corrective leg began with that rejection.

Solana price loses bullish momentum — will $126 support prevent a deeper pullback? - 1

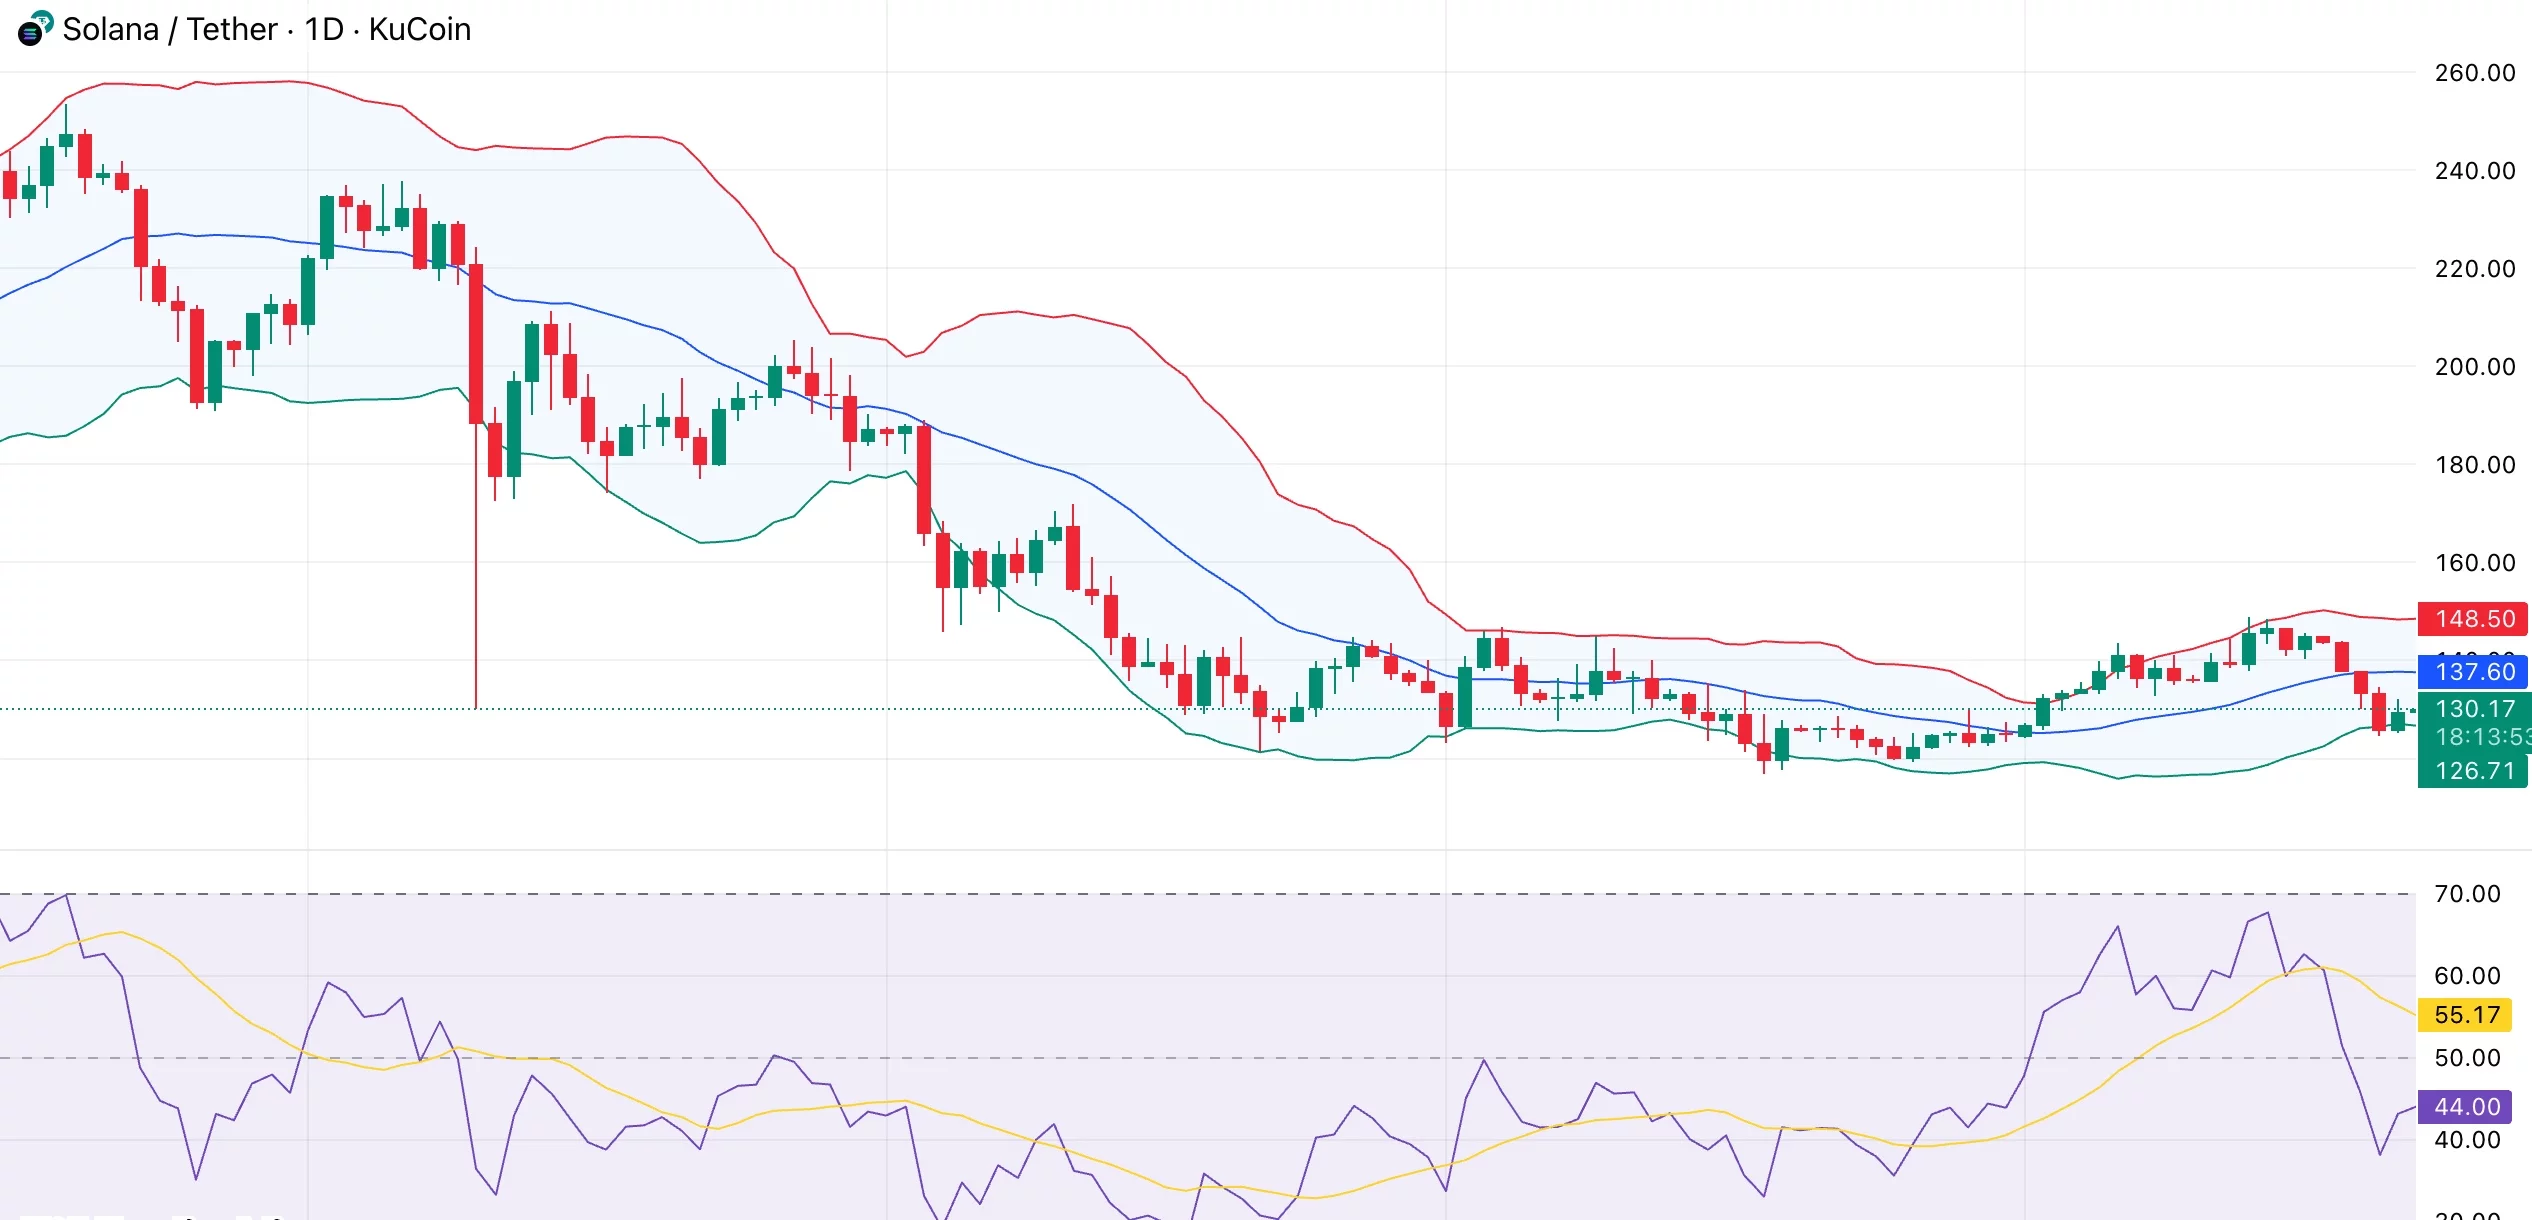
SOL’s drop below its 20-day moving average suggests a loss of short-term momentum. Growing downward pressure is indicated by the daily relative strength index falling below the neutral 50 mark and into the low-40s. The corrective pattern has persisted because recent attempts at a bounce have stalled at lower highs.

Near-term support is clustered between $126 and $128, an area that lines up with the lower Bollinger Band and a previous consolidation zone. This zone is now under pressure. A sustained daily close below $126 would likely open the door to a deeper pullback toward the $118–$120 area, where earlier demand emerged.

On the upside, recovery attempts are likely to face resistance near $137–$140, followed by the major $145–$150 zone. Until price reclaims those levels and regains the 50-day moving average, rallies may struggle to gain traction.

Market Opportunity
Bullish Degen Logo
Bullish Degen Price(BULLISH)
$0.00929
$0.00929$0.00929
-1.58%
USD
Bullish Degen (BULLISH) Live Price Chart
Disclaimer: The articles reposted on this site are sourced from public platforms and are provided for informational purposes only. They do not necessarily reflect the views of MEXC. All rights remain with the original authors. If you believe any content infringes on third-party rights, please contact service@support.mexc.com for removal. MEXC makes no guarantees regarding the accuracy, completeness, or timeliness of the content and is not responsible for any actions taken based on the information provided. The content does not constitute financial, legal, or other professional advice, nor should it be considered a recommendation or endorsement by MEXC.

You May Also Like

Republic Europe Offers Indirect Kraken Stake via SPV

Republic Europe Offers Indirect Kraken Stake via SPV

Republic Europe launches SPV for European retail access to Kraken equity pre-IPO.
Share
bitcoininfonews2026/01/30 13:32
cpwrt Limited Positions Customer Support as a Strategic Growth Function

cpwrt Limited Positions Customer Support as a Strategic Growth Function

For many growing businesses, customer support is often viewed as a cost center rather than a strategic function. cpwrt limited challenges this perception by providing
Share
Techbullion2026/01/30 13:07
Chorus One and MEV Zone Team Up to Boost Avalanche Staking Rewards

Chorus One and MEV Zone Team Up to Boost Avalanche Staking Rewards

The post Chorus One and MEV Zone Team Up to Boost Avalanche Staking Rewards appeared on BitcoinEthereumNews.com. Through the partnership with MEV Zone, Chorus One users will earn extra yield automatically. The Chorus One Avalanche node has a total stake of over 1.7 million, valued at around $55 million. This collaboration will introduce MEV Zone to both public nodes and Validator-as-a-Service. The Avalanche network stands to benefit from fairer and more efficient markets due to enhanced transparency. Chorus One, a highly decorated institutional-grade staking provider, has inked a strategic partnership with MEV Zone to enhance yield generation on the Avalanche (AVAX) network. The Chorus One partnered with MEV Zone to increase the AVAX staking yields, while simultaneously contributing to the general growth of the Avalanche network. “At Chorus One, we see this as an important step in our ongoing journey to provide robust infrastructure and innovative yield strategies for our partners and clients,” the announcement noted.  Why Did Chorus One Partner With MEV Zone? The Chorus One platform has grown to a top-tier institutional-grade staking ecosystem, with more than 40 blockchains, since 2018. In a bid to evolve with the needs of crypto investors and the supported blockchains, Chorus One has inked several strategic partnerships in the recent past, including MEV Zone. In the recent past, MEV Zone has specialized in addressing the Maximal Extractable Value (MEV) challenges on the Avalanche network. The MEV Zone will help Chorus One’s AVAX node validator to use Proposer-Builder Separation (PBS). As such, Chorus One’s AVAX node will seamlessly select certain transactions that are more profitable when making blocks. For instance, MEV Zone will help Chorus One’s AVAX node validator to capture arbitrage and liquidation transactions more often since they are more profitable.  How will Chorus One’s AVAX Stakers Benefit Via This Partnership? The Chorus One AVAX node has grown over the years to more than 1.77 million coins staked, valued…
Share
BitcoinEthereumNews2025/09/18 03:19