

Ethereum Price Holds $2,680 After Liquidation Sweep—Can the Bulls Prevent a Drop to $2,373?

The post Ethereum Price Holds $2,680 After Liquidation Sweep—Can the Bulls Prevent a Drop to $2,373? appeared first on Coinpedia Fintech News
Ethereum price has stabilised near the $2,680 level after a sharp sell-off that triggered heavy long liquidations across derivatives markets. Despite a short-term bounce, volatility remains elevated, and bears continue to control near-term momentum. ETH is now trading within a key support range, making the upcoming monthly close critical for confirming whether this zone holds as a base for a rebound or opens the door to a deeper corrective move.
The daily chart reflects a market transitioning from a strong 2025 uptrend into a corrective and consolidation phase. After topping near the $4,800 region, ETH has steadily printed lower highs and lower lows, signaling weakening bullish control. Price is now testing a critical horizontal demand zone around $2,700–$2,750, which previously acted as a major accumulation area. This level, combined with visible trendline and volume behavior, makes the current structure crucial for determining ETH’s near-term direction.
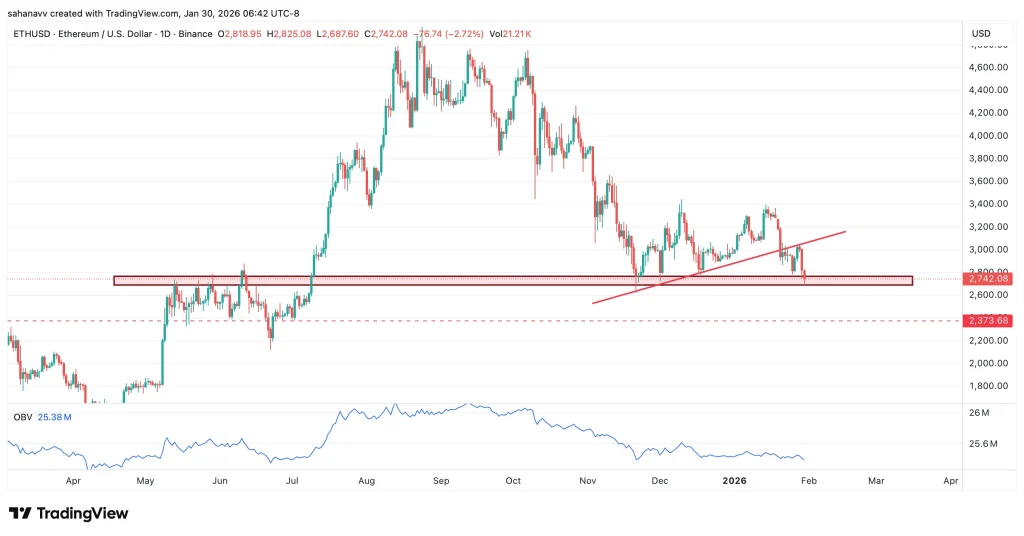
The chart highlights a breakdown from a rising trendline, indicating loss of short-term bullish momentum. ETH is hovering just above a key support band near $2,740, while the next major downside level sits around $2,370. OBV continues to trend lower, suggesting declining buying pressure and distribution rather than accumulation. Repeated rejections near the $3,200–$3,400 zone confirm strong overhead supply. Failure to reclaim the broken trendline increases the probability of further downside continuation.
Overall, Ethereum remains at a make-or-break zone. The confluence of horizontal support, prior consolidation, and declining OBV suggests caution in the near term. A decisive daily close below $2,700 would confirm bearish continuation, while a strong bounce with volume expansion could revive short-term recovery hopes. Until ETH reclaims the $3,000–$3,100 region, rallies are likely to face selling pressure, keeping the broader bias neutral-to-bearish.
By month-end, ETH is likely to trade between $2,600–$2,900, with a bearish bias if support weakens. A breakdown toward $2,370 could weigh on February trades, favoring range-bound or defensive strategies. Conversely, holding $2,700 may allow February to open with stabilization and selective dip-buying interest.
You May Also Like

Markets await Fed’s first 2025 cut, experts bet “this bull market is not even close to over”

Red Dress Collection Concert Launches American Heart Month with Star-Studded Awareness Effort
