

Bitcoin (BTC) Slips Under $80K: Critical Support Zones After $82.8K Rejection
Key Takeaways
- BTC retreated to $79,800 following a rejection at the $82,800 resistance zone
- Spot Bitcoin ETF inflows reached $1.105 billion weekly — the strongest performance since January
- Critical support zone identified between $76,000 and $78,000, matching the 200-day EMA
- Market analyst Ali Charts highlights $80,300 as the crucial whale cost basis threshold
- Glassnode pinpoints $85,200 as the next significant overhead resistance level
Bitcoin slipped beneath the $80,000 threshold on Thursday following a rejection near $82,800, ultimately testing a low of $79,800. This pullback occurred even as spot ETF demand recorded its strongest weekly performance in months, exceeding $1 billion in net inflows.
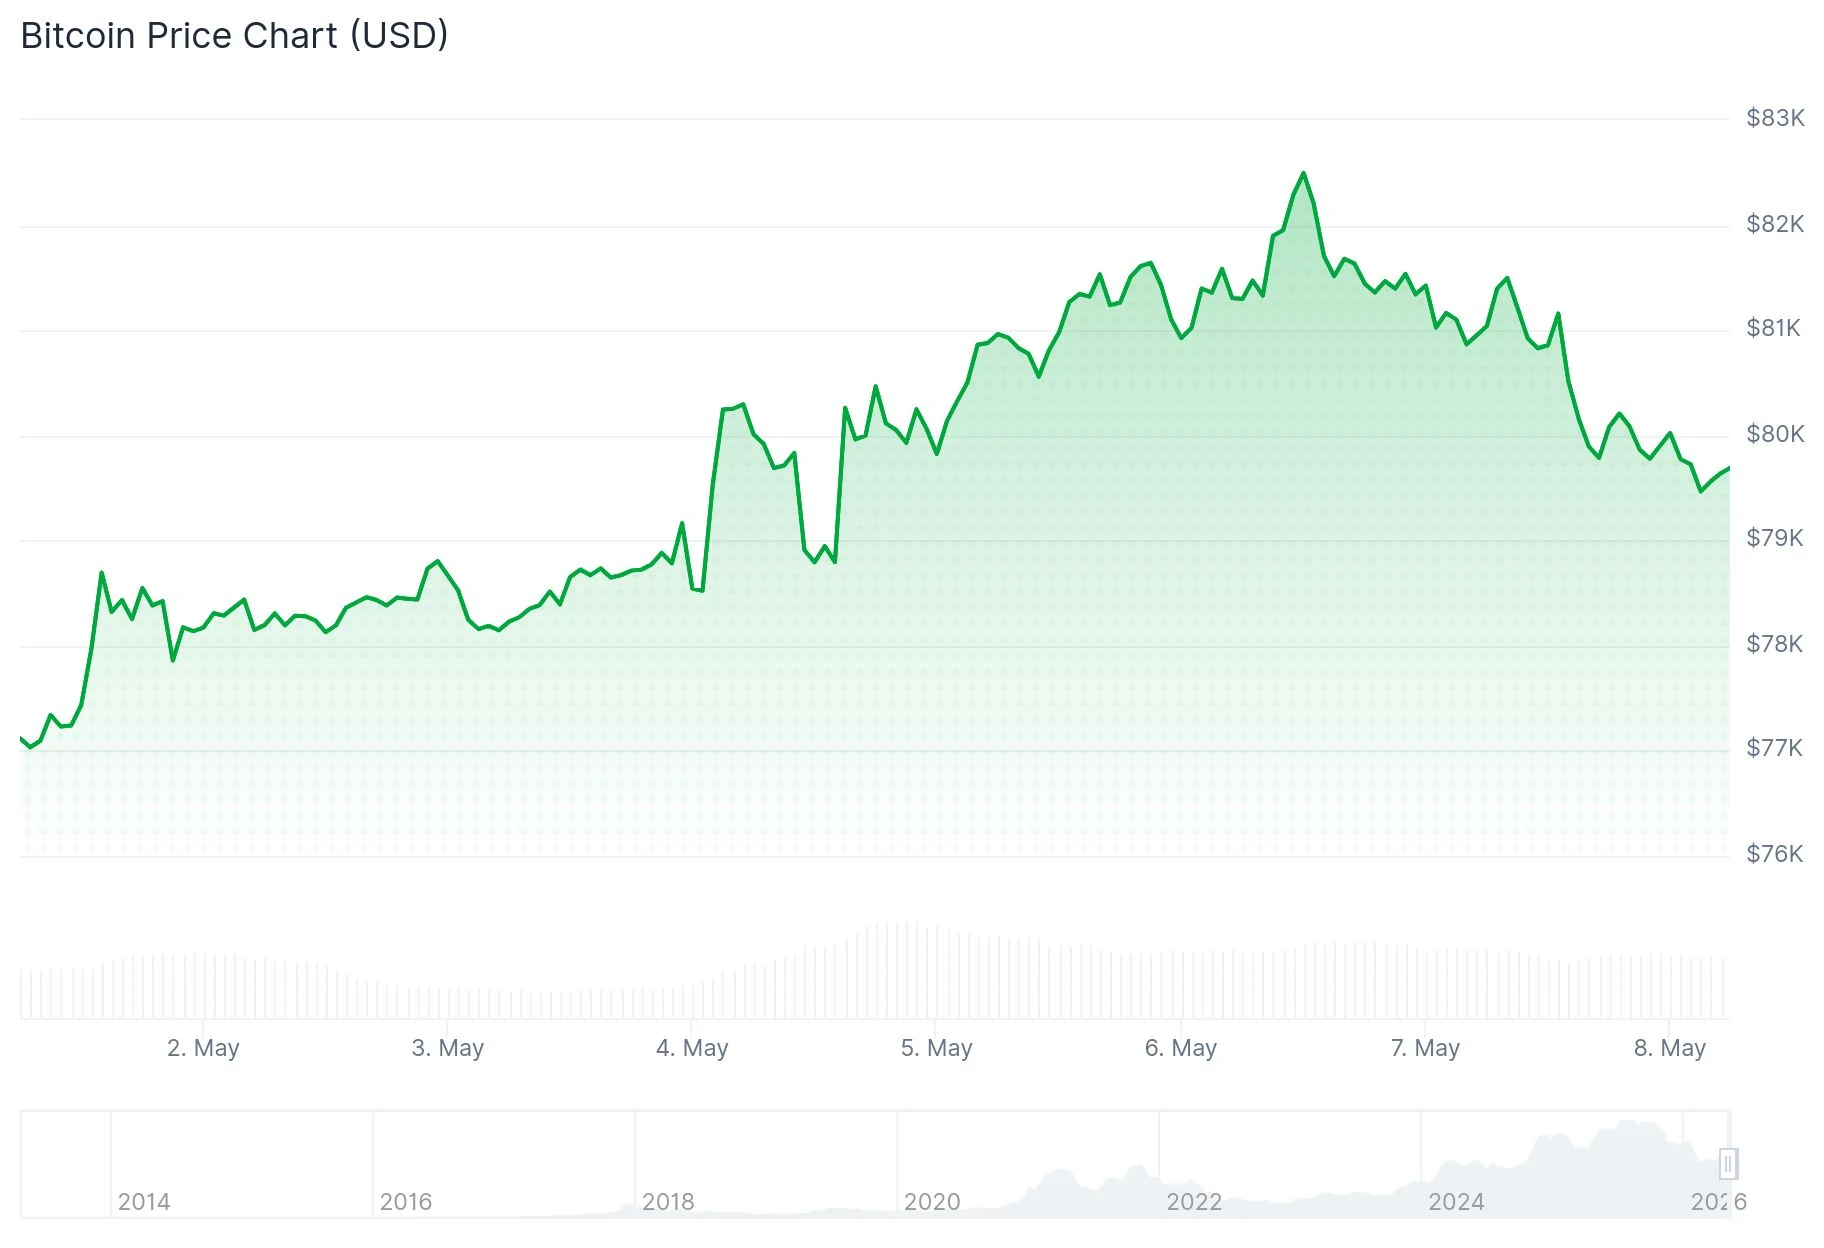 Bitcoin (BTC) Price
Technical indicators revealed bearish divergence patterns across both the one-hour and four-hour RSI timeframes, suggesting weakening upward momentum. These divergences emerge when price action prints higher peaks while the RSI indicator trends downward — typically signaling that bullish energy is dissipating.
Crypto analyst Jelle noted that the 200-day moving average and exponential moving average convergence is functioning as overhead resistance, while identifying the $78,000 level as primary support. Meanwhile, trader Killa XBT outlined a deeper support corridor ranging from $76,300 down to $74,700 should bears maintain control.
The weekly opening price of $78,500 has emerged as the immediate battleground for bulls attempting to defend against further downside. Should that level fail, a daily fair value gap spanning $76,000 to $78,000 coincides with the 200-day EMA, making it a probable target for retesting.
Why $80,300 Matters for Whale Positions
Market analyst Ali Charts emphasized $80,300 as the most significant price level currently under observation. This figure corresponds to the average acquisition cost for newer whale entities — large holders who accumulated Bitcoin over the past 155 days.
When BTC trades beneath $80,300, these substantial holders find themselves underwater on their positions. Bitcoin momentarily surged toward $82,800 before reversing below this threshold. Extended trading below $80,300 could trigger break-even selling from these whales, potentially amplifying downward momentum.
Spot Bitcoin ETF products registered five consecutive sessions of positive net inflows through Wednesday, accumulating $1.69 billion — marking the longest sustained inflow sequence since July 2025. Wednesday’s session alone contributed $46.3 million in fresh capital.
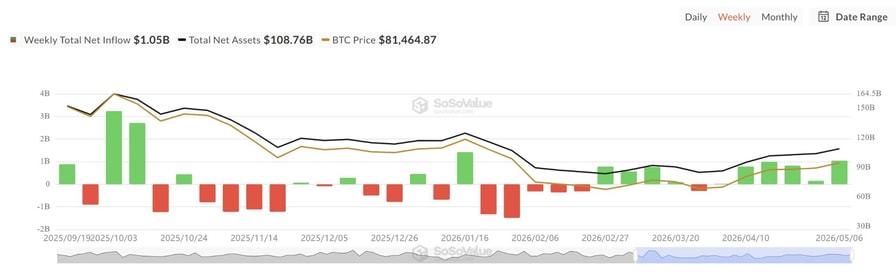 Source: SoSoValue
Glassnode analytics revealed that Bitcoin has successfully breached two important onchain price markers: the True Market Mean positioned at $78,200 and the Short-Term Holder Cost Basis at $79,100. Maintaining prices above both thresholds places the majority of recent market participants back into profitable territory.
ETF Momentum and the Path Toward $85,200
Santiment tracking data demonstrated that Bitcoin’s total wallet count decreased by 245,000 addresses over a five-day span — representing the steepest reduction witnessed in approximately two years. Santiment analysts observed this pattern resembles the June-July 2024 sequence when over 964,000 wallets exited before a substantial bullish surge materialized.
Perpetual futures funding rates continue showing negative values despite BTC’s 26% bounce from February’s lows, indicating short position holders remain actively engaged. Glassnode data shows long-term holders are distributing approximately $180 million daily in realized profits — a calculated pace rather than aggressive capitulation.
Glassnode’s subsequent upside target sits at the Active Realized Price of $85,200, which represents the aggregate cost basis for all circulating supply excluding dormant coins. This zone is anticipated to present elevated resistance from overhead sellers.
Bitcoin was exchanging hands just beneath the $80,000 mark during Thursday’s U.S. trading session. Glassnode analysts emphasized that a decisive break above $85,200, supported by sustained spot market demand, would be necessary to validate that the recovery possesses fundamental strength.
The post Bitcoin (BTC) Slips Under $80K: Critical Support Zones After $82.8K Rejection appeared first on Blockonomi.


You May Also Like

The CLARITY Act Might Be the Most Important Crypto Law Ever Passed

Three Skills Finance Professionals Need in the Age of AI


