

XRP Elliott Wave Setup Points To Strong Surge Through Late May Breakout
XRP trades near $1.37 as Elliott Wave setup targets a late May breakout, with support at $1.31-$1.36 and resistance at $1.47.
XRP is trading near $1.37 as traders track a two-week Elliott Wave setup that points to a possible late May breakout.
The chart shows price compressed between nearby support and resistance, while momentum remains weak but stable after a sharp correction from the 2025 high area.
XRP Elliott Wave Setup Points To Late May Breakout
A market analyst said the primary XRP Elliott Wave structure remains intact on the two-week chart.
The analyst said the current support and resistance apex has little room left. The analyst expects the setup to produce a strong move through the end of May.
“XRP will break that orange resistance,” the analyst said.
The stated support range sits between $1.36 and $1.31. XRP is trading close to that zone, and price has held near the lower part of its recent range.
The analyst listed resistance levels at $1.47, $1.88, and $3.56. These levels are now being watched as possible targets if buying pressure improves.
Elliott Wave analysis is used by some traders to map market cycles. It does not confirm direction by itself, but it can help define key price areas.
XRP Price Holds Near Key Support Zone
XRP/USD is trading near $1.37 on the daily chart. The price remains far below the 2025 high area near $3.50.
The chart shows a strong rally from late 2024 into 2025. That rally was followed by a wide trading range between about $2.00 and $3.50.
XRP later failed to hold the higher channel area. Price then moved lower toward the $1.20 to $1.50 region.
The current structure shows a defensive market. XRP remains below major rising fan lines and below the prior consolidation zone.
Still, buyers appear active near the current level. Repeated sideways movement around $1.30 to $1.50 shows an attempt to form support.
A daily close below $1.30 would weaken the setup. A move below $1.20 could expose the larger $1.00 support area.
Read Also:
Resistance Levels Remain Central For Recovery
The first near-term resistance is close to $1.47 to $1.50. XRP has struggled to move clearly above that area after the recent decline.
A move above $1.50 would be the first step toward a stronger recovery. The next area to watch sits near $1.75 to $1.88.
The $1.88 level also matches the analyst’s listed resistance. A break above that area could bring the $2.00 to $2.20 zone into focus.
That zone was earlier used as support during the broader range. It may now act as resistance if XRP rebounds.
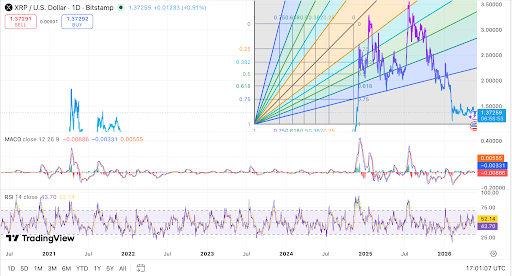 XRP holds near support as Elliott Wave resistance levels tighten. Source: TradingView.
The larger resistance cited by the analyst is $3.56. That level sits near the upper region reached during the 2025 rally.
Momentum data remains mixed. The MACD is still weak, and there is no clear bullish crossover yet.
The RSI is near 43.7, while its moving average is near 52.1. This shows that momentum has not fully recovered.
A move above 50 on the RSI would show improving demand. A move above 60 would support a stronger recovery attempt.
For now, XRP remains in a narrow decision area. The late May breakout view depends on support holding and resistance breaking.
The post XRP Elliott Wave Setup Points To Strong Surge Through Late May Breakout appeared first on Live Bitcoin News.


You May Also Like

Cardano’s May 29 hard fork vote brings ADA’s DeFi weakness into view

Y Combinator rolls out new deal package for crypto startups

China solar panel exports to Africa jump by 83% as demand for clean energy surges


