

Ethereum Price Prediction: On-Chain Smart Money Is Quietly Accumulating While Bitcoin Tests $60K
Ethereum price prediction data shows smart money quietly stacking ETH on Binance as BTC tests $60K and USDT dominance nears a 2022 FTX-era ceiling.
The Ethereum price prediction crowd tends to watch derivatives. On-chain researcher Amr Taha was watching something else. His June 23 CryptoQuant analysis flagged a reserve shift at Binance that does not fit the broader market narrative cleanly. ETH was stacking up on the exchange while almost everything else was moving lower.
Crypto liquidations were surfacing across leveraged desks as Bitcoin tested the $60,000 level. BTC reserves on Binance were thinning out through that stretch, down to 650,800 from a higher reading weeks earlier. The ETH side of the book was doing the opposite. That divergence is what Taha’s note was actually about.
ETH Stacks Up on Binance While BTC Quietly Drains
Binance held roughly 3.63 million ETH in early June. The reserve level on June 23 came in at 3.86 million. Exchange inflows that size tend to read as selling pressure building. This one is harder to categorize, per Taha’s data, given what was happening on the BTC side at the same time.
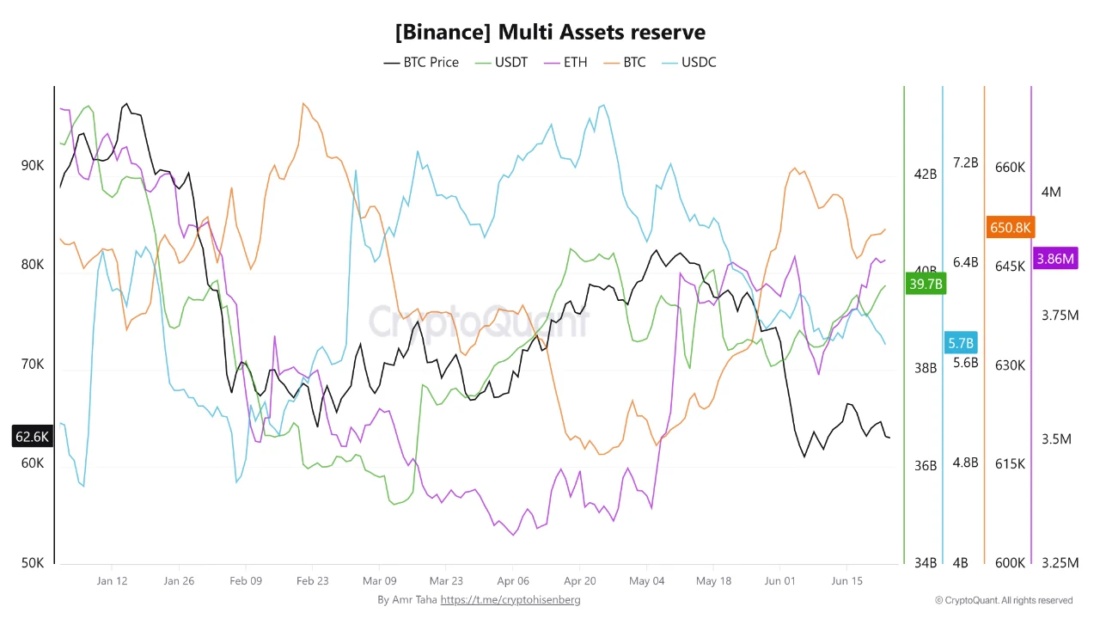
Binance Multi Assets Reserve as of June 23, 2026: ETH at 3.86M, BTC at 650.8K, USDT at $39.7B, USDC at $5.7B. Source: CryptoQuant / Amr Taha
USDC reserves fell to $5.7 billion on the same date. That is roughly $1.95 billion below the April 24 reading near $7.65 billion, a decline of about 25.5%. USDT moved in the opposite direction. Balances climbed to $39.7 billion, up from about $38 billion in late May. Traders watching capital rotating out of Ethereum mainnet have flagged the stablecoin composition shift as a potential setup for deployment. Nothing confirms that. The liquidity is just sitting there.
A second CryptoQuant note from June 23 put the Ethereum divergence plainly. Price has corrected hard from its cycle peak. The network has not cooled to match it. That is roughly the whole tension.
Network Activity Says One Thing. Price Says Another.
Active Ethereum addresses have been spiking well past 800,000 on a recurring basis since early 2026, per CryptoQuant’s active address data. Some days have pushed past one million. ETH price near $1,600 does not look like a network anyone is using. The address data says they are.
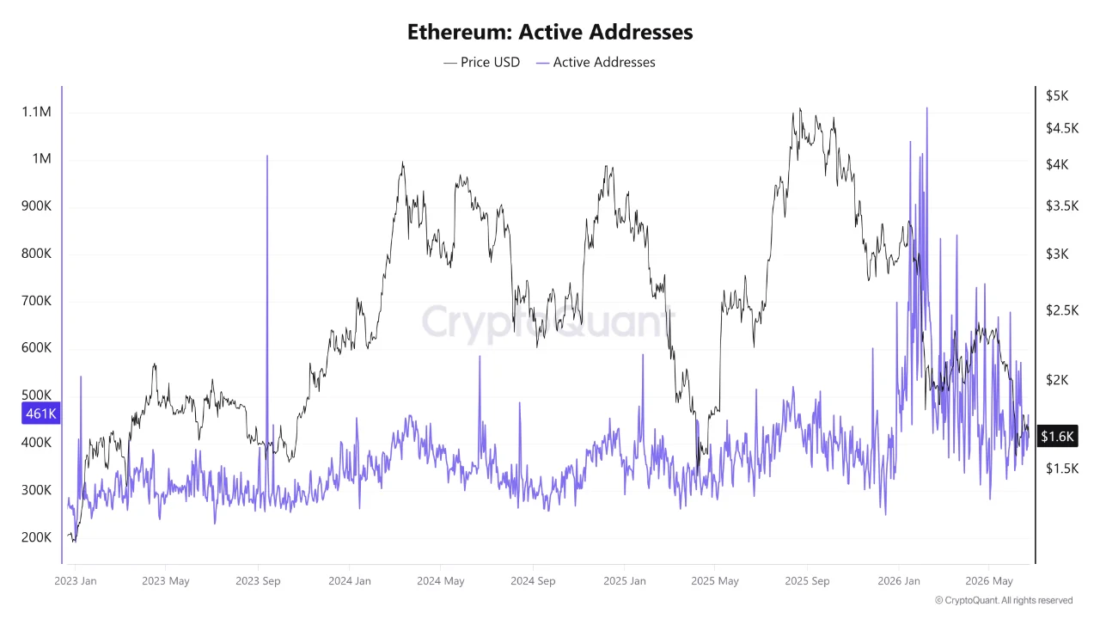
Ethereum Active Addresses vs. Price USD (2023-2026): Address spikes consistently cross 800K and above through 2026 despite ETH price near $1.6K. Source: CryptoQuant
Part of that activity is not bullish in the classic sense. Sharp price drops push users into collateral management on Aave and MakerDAO, avoiding liquidation. The network gets busier during the pain. That is a kind of stickiness, though not the kind that gets celebrated.
The CryptoQuant note pointed to a separate behavior layer. Discounted prices have historically pulled smart money off centralized exchanges into private wallets. EigenLayer and liquid staking positions give holders a reason to stay rather than exit outright. Analysts following Ethereum accumulation trends have noted the same retention pattern showing up in prior cycle bottoms. Whether this is one of those is another matter.
The Ceiling USDT Dominance Has Not Broken Since FTX
USDT dominance was sitting at 8.75% on June 24. The 9% level is 0.25 percentage points away. That gap is thin. The zone has also become a wall with a track record.
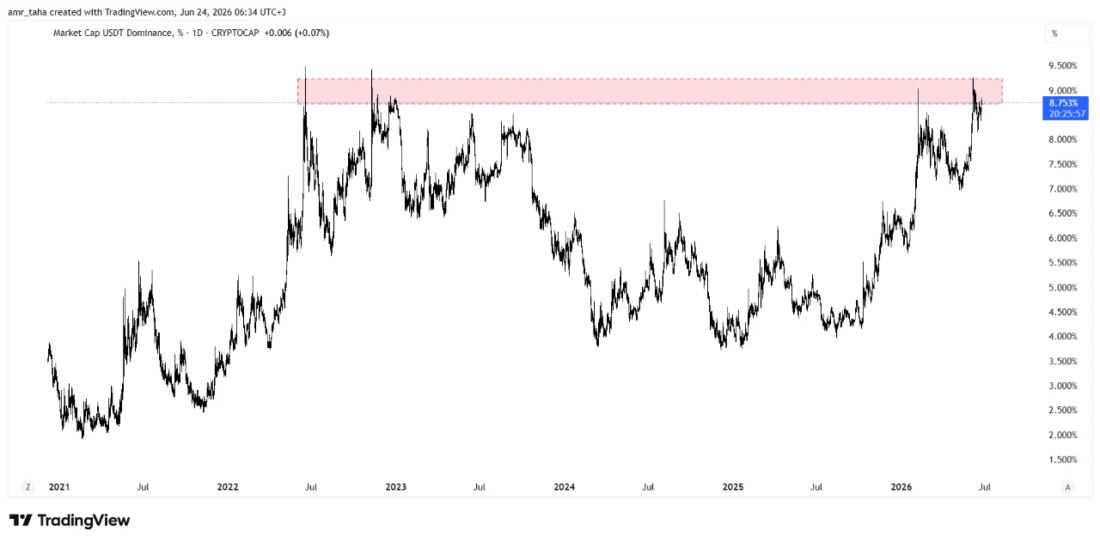
USDT Market Cap Dominance (2021-2026): Reading at 8.75% on June 24, 2026, approaching the 9% resistance zone last breached during the FTX collapse in November 2022. Source: TradingView / amr_taha
The last time USDT dominance closed above 9% was November 2022, around November 9, per Taha’s analysis. That was the FTX collapse window. Dominance did not hold above that level. It rolled back. Bitcoin was near $16,000 at the time. The recovery that followed eventually extended past $123,000.
The pattern is documented, not predictive. Dominance has pushed toward 9% in other periods without touching off a broad rally. What Taha flagged is that rejections from that zone have historically lined up with recovering crypto markets. The zone is there again. The setup is there. The outcome is not.
Disclaimer: This article is based on on-chain data and technical analysis from cited sources. It does not constitute financial or investment advice.
The post Ethereum Price Prediction: On-Chain Smart Money Is Quietly Accumulating While Bitcoin Tests $60K appeared first on Live Bitcoin News.


You May Also Like

Covéa Chooses Shift Technology as Strategic Partner for Fraud and Risk Management

After 'circling the drain' Trump’s DJT stock finally plops in

Black Lake and Nuva Labs Tokenize $25 Million in Institutional Mortgages on Provenance Blockchain


