

The Graph Price Prediction 2025, 2026 – 2030: Will GRT Price Go Up?
The post The Graph Price Prediction 2025, 2026 – 2030: Will GRT Price Go Up? appeared first on Coinpedia Fintech News
Story Highlights
- The live price of The Graph crypto is $ 0.05157371.
- The Graph price is expected to go as high as $1.00 in 2025.
- GRT price with a potential surge could reach a maximum of $3.54 by 2030.
AI may be taking center stage in today’s tech revolution, but behind every smart application lies the challenge of accessing and organizing reliable data. That’s where The Graph (GRT) steps in—an innovative indexing protocol transforming how blockchain data is queried.
As interest in The Graph surges, especially after its major 2025 upgrades and the launch of substreams-powered subgraphs, the question on everyone’s mind is: Can GRT price reach $1? In this article, we break down its technical potential, rising developer adoption, and market sentiment in our detailed The Graph Price Prediction 2025–2030.
Table of contents
- Story Highlights
- The Graph (GRT) Analysis 2025 Displays Muted Price Action
- Why On-Chain Hints Flourishing Network and Ecosystem Growth In “The Graph”?
- GRT Price Chart History (2021-2025)
- GRT Price Prediction 2025
- GRT Price Target November 2025
- GRT Coin Price Prediction 2026-2030
- What Does The Market Say?
- FAQs
The Graph Price Today
| Cryptocurrency | The Graph |
| Token | GRT |
| Price | $0.0516 |
| Market Cap | $ 547,207,531.27 |
| 24h Volume | $ 24,735,549.2101 |
| Circulating Supply | 10,610,203,893.5855 |
| Total Supply | 11,410,219,530.3187 |
| All-Time High | $ 2.8751 on 12 February 2021 |
| All-Time Low | $ 0.0398 on 10 October 2025 |
The Graph (GRT) Analysis 2025 Displays Muted Price Action
The Graph Network, has recently improved its fundamental growth, yet this strength is sharply diverging from its prolonged bearish GRT price action.
The network, is majorly used by developers and data consumers who pay to query data, is flourishing, per onchain. yet, the GRT remains significantly suppressed, presenting a notable contrast that is at the heart of its current analysis.
Why On-Chain Hints Flourishing Network and Ecosystem Growth In “The Graph”?
As per the data onchain, the performance of The Graph Network can be directly assessed by the growing “volume of queries” and the “accrual of query fees”.
In this context, the data reveals that over the last six months, its query volume has impressively reached 11.6 billion, which displays a clear sign of robust developer adoption that has been particularly fast since the network’s migration to Arbitrum.
Similarly, the query fees generated by data consumers on Arbitrum have also reached an all-time high of $8.11 million in August.
This success is supported by a large community of over 167,000 delegators and 7,204 active curators, all contributing to the network’s health.
In addition, the growing ecosystem is also in the spotlight by recent integrations with major brands like Tron, pointing to a strengthening on a fundamental level.
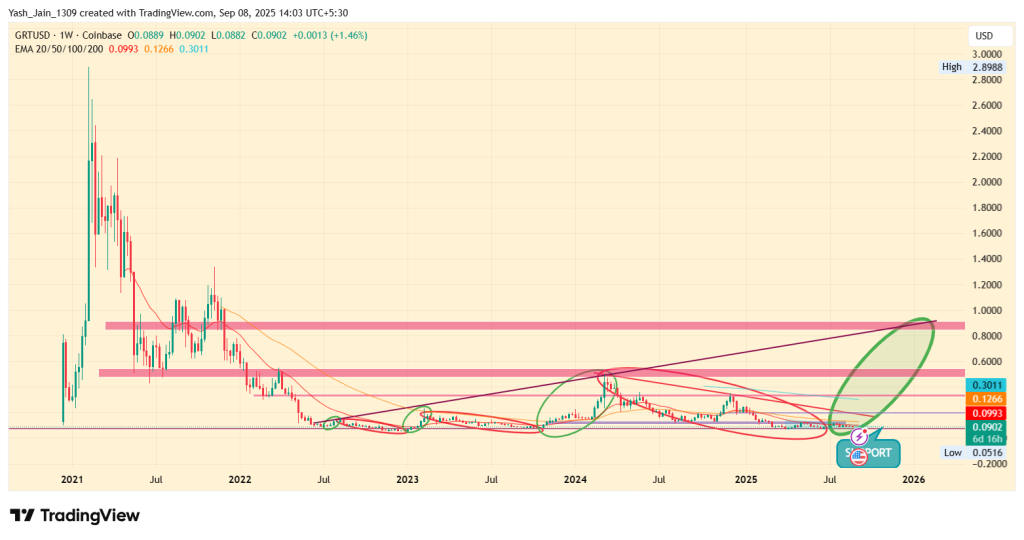
GRT Price Chart History (2021-2025)
Despite having strong fundamentals, the Graph (GRT) token has seen a muted price journey. It’s currently down more than 80% from its 2024 peak and over 95% from its all-time high in 2021. This disconnect between its price and its core strength is a key point of technical analysis.
Since the 2021 crash, GRT has been declining on its monthly chart and reached $0.055 by 2022 end. Then in the beginning of 2023 started rising and reached $0.49 in March 2024. Since then, the price of GRT has continued a multi-month correction.
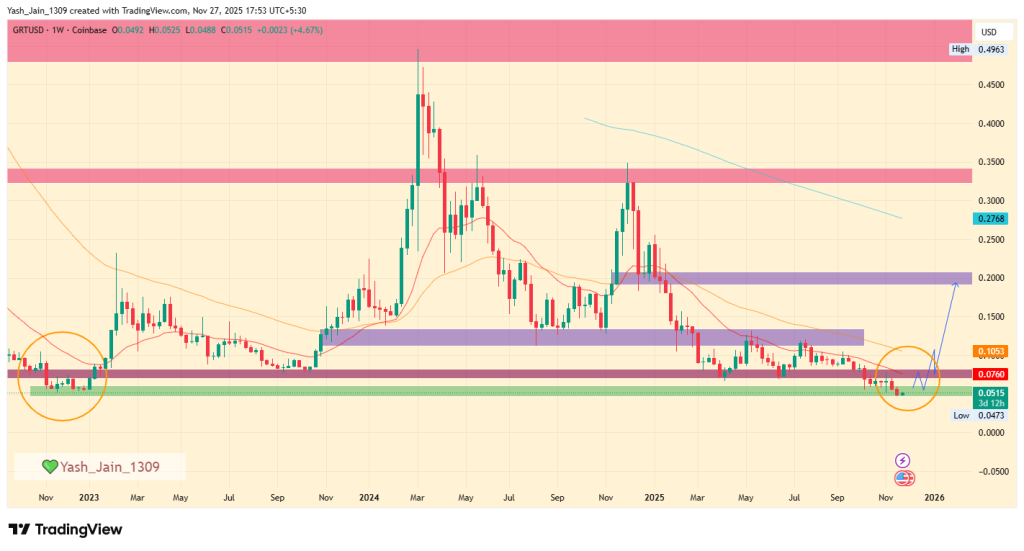
Currently, GRT is in a prolonged downtrend that has lasted nearly 21 months. It has now fallen below the critical $0.08 support level and reached $0.051 low in October 2025.
GRT Price Prediction 2025
| Year | Potential Low ($) | Potential Average ($) | Potential High ($) |
| 2025 | 0.05 | 0.20 | 0.34 |
GRT Price Target November 2025
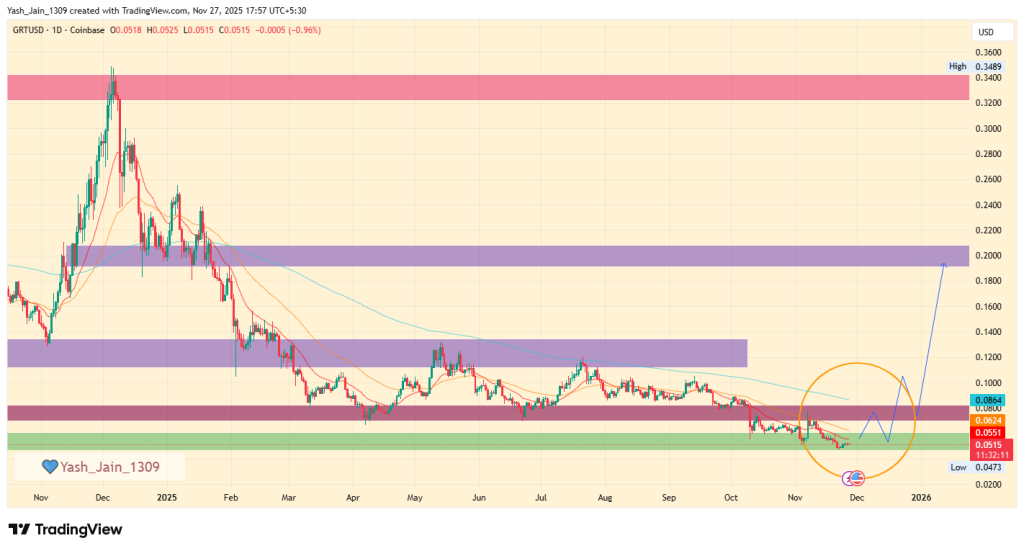
As we approach December 2025, we observe the price has faced persistent challenges, consolidating below the crucial $0.08 support level throughout October and November.
However, there are odds of an exciting opportunity ahead. A resurgence of demand from bullish investors could drive the GRT price towards an uplifting rally, potentially reaching $0.20 most probably this December.
Conversely, if this rally does not materialize, we may witness the price continuing to stabilize within the $0.050 to $0.080 range.
| Month | Potential Low ($) | Potential Average ($) | Potential High ($) |
| The Graph Price Targets November 2025 | 0.055 | 0.14 | 020 |
GRT Coin Price Prediction 2026-2030
| Year | Potential Low ($) | Potential Average ($) | Potential High ($) |
| 2026 | 1.05 | 1.20 | 1.75 |
| 2027 | 1.55 | 1.70 | 2.15 |
| 2028 | 2.15 | 2.20 | 2.65 |
| 2029 | 2.25 | 2.70 | 3.25 |
| 2030 | 3.15 | 3.20 | 3.55 |
What Does The Market Say?
| Firm Name | 2025 | 2026 | 2030 |
| Changelly | $0.122 | $0.320 | $1.89 |
| priceprediction.net | $0.322 | $0.493 | $2.26 |
| DigitalCoinPrice | $0.23 | $0.27 | $0.58 |
CoinPedia’s GRT Price Prediction
According to Coinpedia’s GRT price prediction, if the community explores new blockchain integrations, it could reach a new high of $1.00 in 2025.
However, if the coin remains volatile due to its newness in the crypto space, the Graph’s price could drop to $0.60.
We expect the Graph price to reach the heights of $1.00 by the end of 2025.
| Price Prediction | Potential Low ($) | Average Price ($) | Potential High ($) |
| 2025 | 0.60 | 0.80 | 1.00 |
To explore Kusama’s (KSM) cutting-edge developments, check out our Kusama price prediction 2025, 2026 – 2030!
Never Miss a Beat in the Crypto World!
Stay ahead with breaking news, expert analysis, and real-time updates on the latest trends in Bitcoin, altcoins, DeFi, NFTs, and more.
FAQs
Yes, GRT is an ERC-20 token working on the Ethereum blockchain.
GRT is projected to trade between $0.60 and $1.00 in 2025, depending on market conditions and adoption.
No, GRT cannot be mined as it is a non-mineable token.
By 2030, GRT could reach a high of $3.54, driven by network growth, strong demand, and deeper blockchain integration.
GRT can be traded on popular exchanges like Binance, Coinbase Pro, Kraken, KuCoin, and Huobi Global, amongst others.
At the time of writing, the price of 1 The Graph Token was $ 0.05157371
GRT
BINANCE
You May Also Like

OSL Hong Kong Lists XRP for Professional Investors Amid Signs of Sustained Market Interest

Will XRP Price Increase In September 2025?