

XRP Crashes 9.5%, But TD Sequential Flashes A Buy Signal
A cryptocurrency analyst has pointed out how the Tom Demark (TD) Sequential has just given a buy signal on the weekly XRP price chart.
TD Sequential Is Printing A Weekly Buy Signal For XRP
In a new post on X, analyst Ali Martinez has talked about a TD Sequential signal that has appeared on the weekly XRP chart. The “TD Sequential” refers to an indicator from technical analysis (TA) that’s generally used for locating points of probable reversal in a given asset’s price.
It involves two phases: the setup and countdown. In the first phase, the “setup,” the indicator counts up candles of the same polarity (that is, whether red or green) up to nine. Once these nine candles, which don’t have to be consecutive, are in, it gives a reversal signal.
Naturally, this signal is a bullish one if the candles leading up to the setup’s completion were red. Similarly, the asset may see a bearish turnaround if the candles were green.
As soon as the setup is over, the second phase, the “countdown,” picks off. This phase is quite similar to the setup, with the only difference being that the TD Sequential counts up thirteen candles here instead.
After the thirteen candles of the countdown are also in, the asset could be considered to have reached another point of trend exhaustion. In other words, it may be likely to see another reversal.
Now, here is the chart shared by Martinez that shows the TD Sequential setup that has formed in the 1-week price of XRP:
As displayed in the above graph, XRP has completed this TD Sequential setup with nine red candles, a sign that the bearish trend may have reached an end. The signal has appeared as the cryptocurrency’s price has started to breach below the $2.0 level following a significant decline of 9.5% during the past day.
It now remains to be seen whether XRP will now turn itself around like the TD Sequential suggests, or if more bearish price action is in store. Another digital asset that has witnessed a TD Sequential setup is Ethereum. In its case, the signal may be holding up so far.
As Martinez has highlighted in another X post, Ethereum’s 12-hour price completed a setup with nine green candles on Saturday.
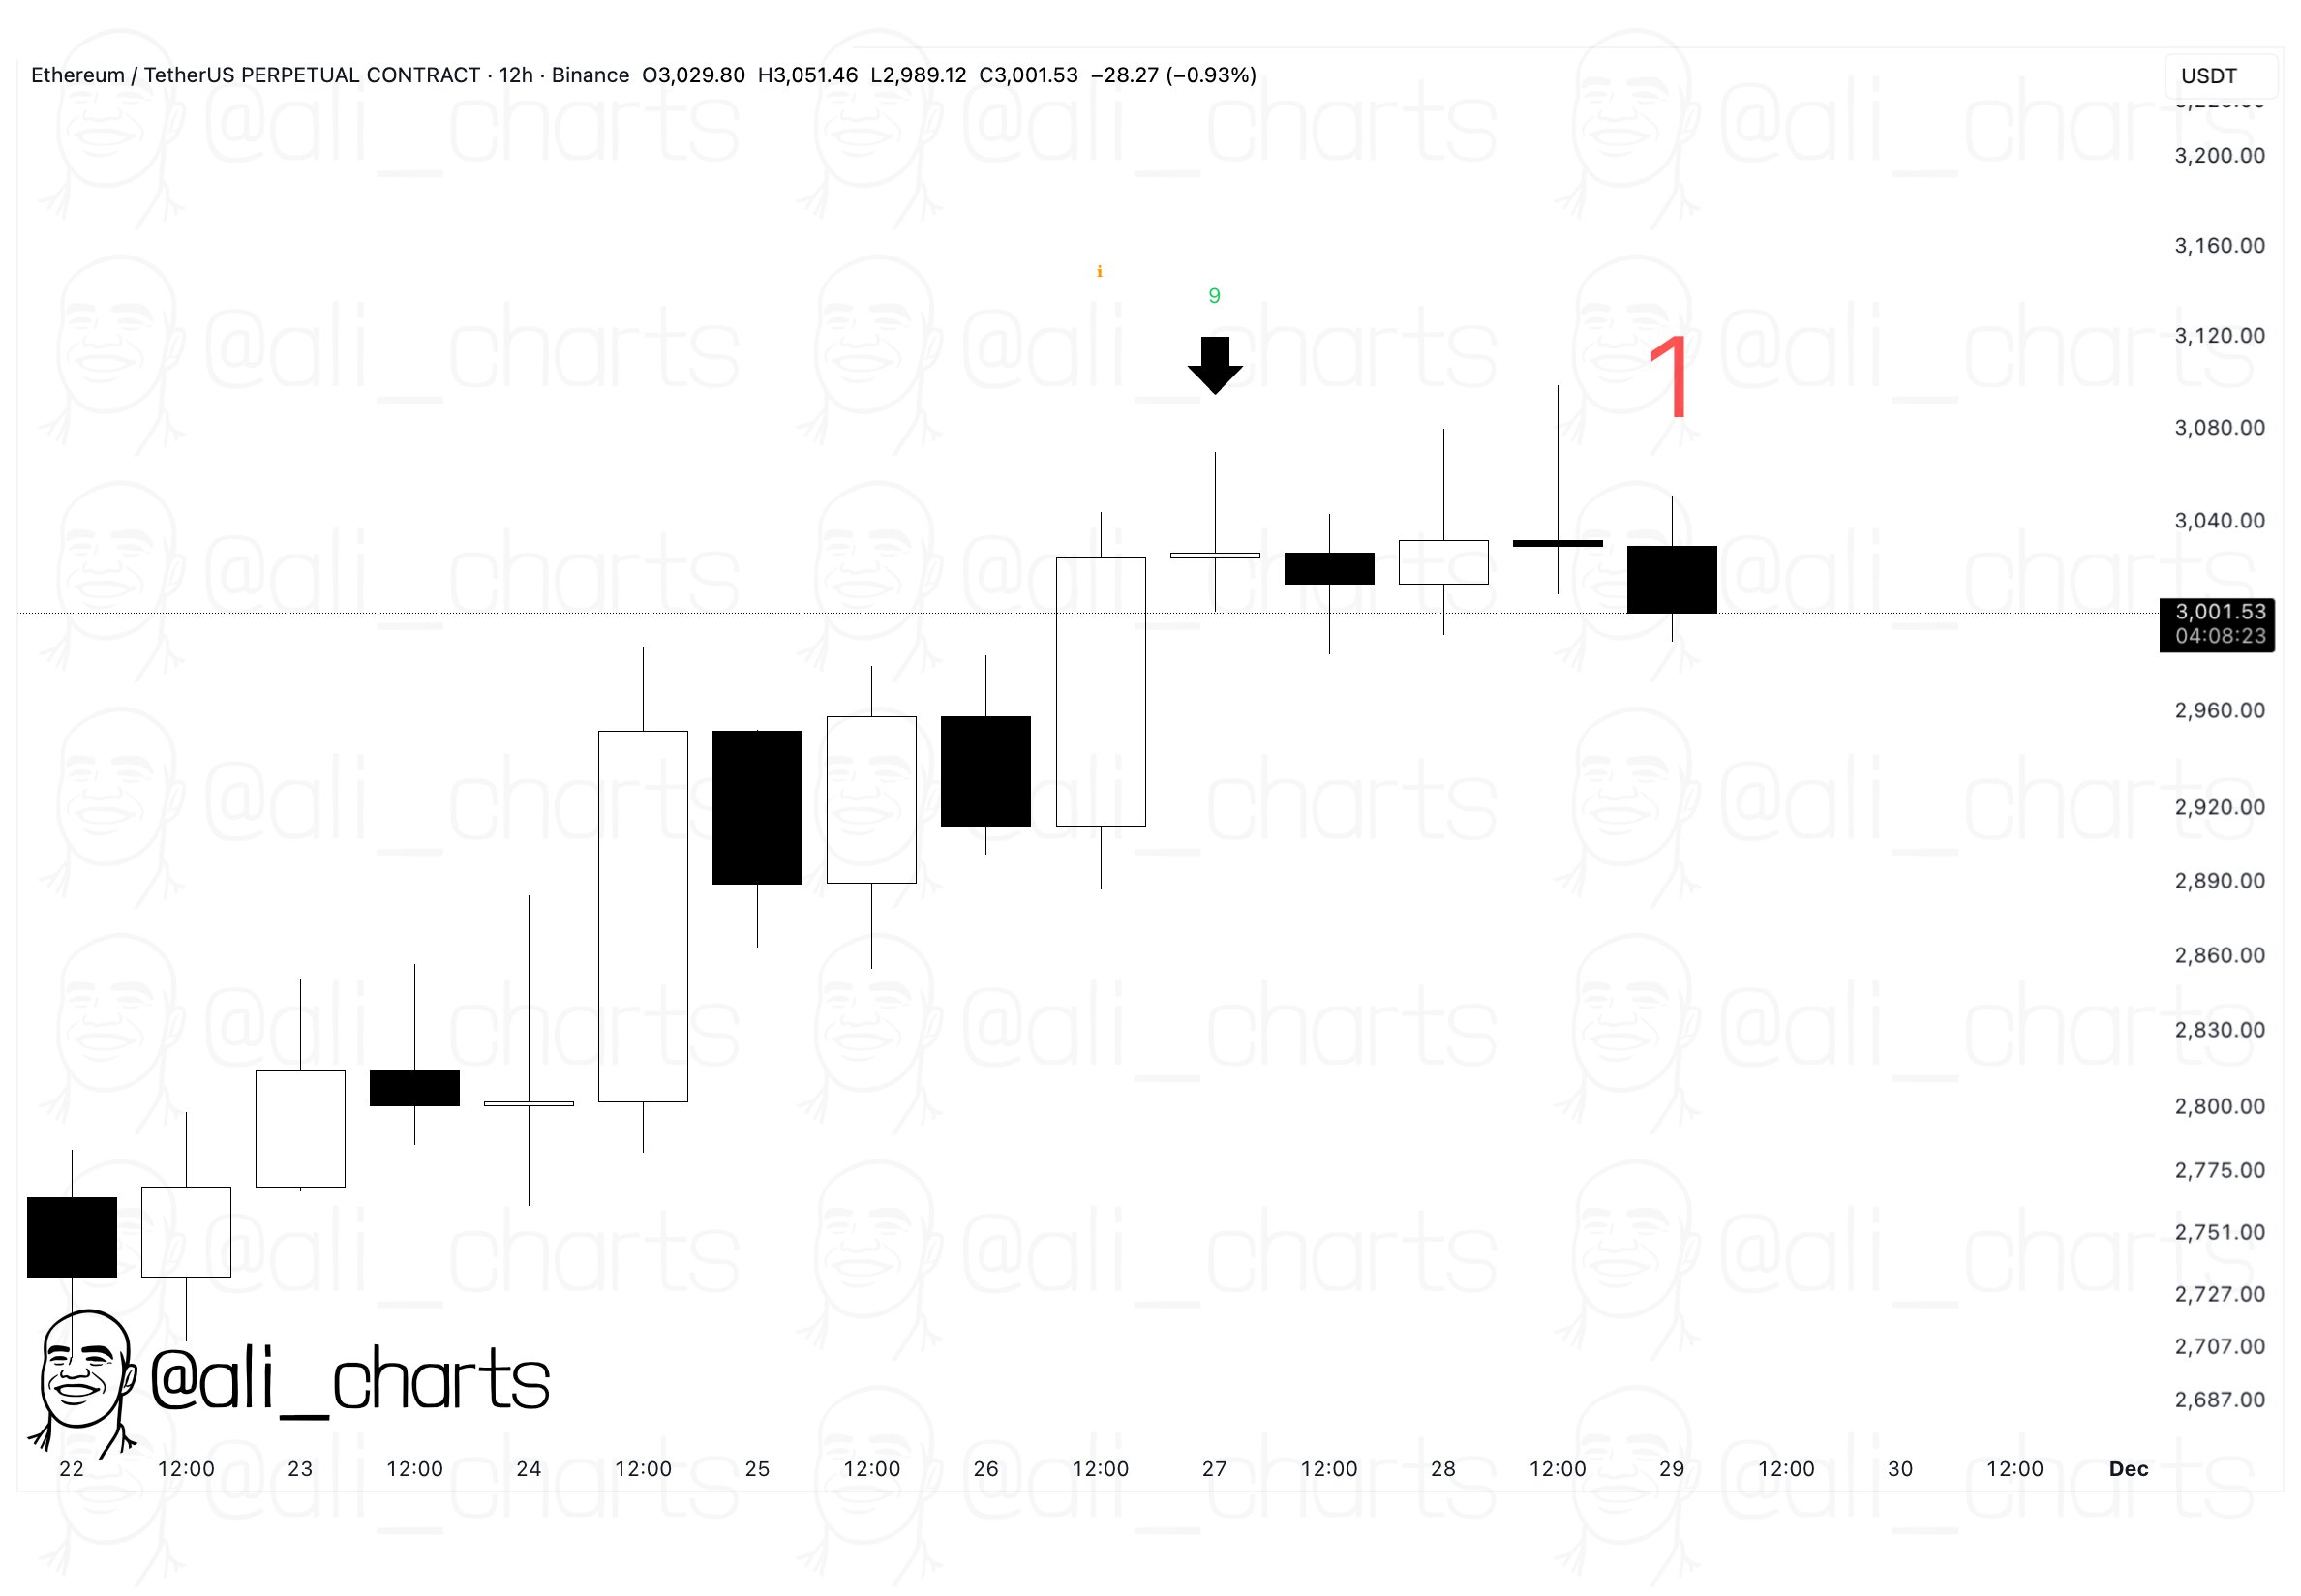
Since this bearish signal has emerged, Ethereum’s price has plummeted back to the $2,750 level and has erased its recent recovery gains.
XRP Price
At the time of writing, XRP is floating around $2, down more than 9% in the last seven days.
You May Also Like

Çin’i Karıştıran Bitcoin İddiası: En Büyük Şirketlerden Birinde Skandal Ortaya Çıktı!

Polygon Tops RWA Rankings With $1.1B in Tokenized Assets

VC Roundup: Big money, few deals as crypto venture funding dries up
Crypto venture funding was weak in November, with only a few major raises driving totals, as overall deal activity reached one of its lowest points this year. Venture capital funding in the cryptocurrency sector remained muted in November, continuing a broader slowdown that has persisted through late 2025. Deal activity was once again concentrated in a small number of large raises by established companies.As Cointelegraph previously reported, the third quarter saw a similar pattern: total funding climbed to $4.65 billion, according to Galaxy Digital, but deal counts lagged as capital flowed primarily to bigger, more mature firms.November reflected the same divergence. Figures from RootData showed only 57 disclosed crypto funding rounds during the month — one of the weakest tallies of the year — despite headline-grabbing raises such as Revolut’s $1 billion round and Kraken’s $800 million raise ahead of its anticipated initial public offering.Read more