

Why Bitcoin Traders Fear A Repeat Of July 2024’s Crash Next Week
Bitcoin is again trading under the shadow of a potential yen carry-trade shock as markets head into the 9–10 December FOMC meeting and a likely hawkish turn from the Bank of Japan at the December 18-19 meeting. The setup echoes last summer’s episode, when a policy shift in Tokyo triggered rapid deleveraging across risk assets, including crypto.
Will The Bitcoin Price Crash Next Week?
Analyst Benjamin Cowen explicitly links today’s environment to that July shock. He reminded followers that “in July 2024, the Fed cut rates while the BOJ raised rates, leading to the unwind of the carry trade. Bitcoin capitulated into it, and found a low 1 week later.” He added, “Good chance this happens again on December 10th (Fed cuts, BOJ raises rates). So maybe Bitcoin finds a low mid-Dec?”
The precise sequencing last year was more nuanced – markets aggressively priced Fed easing while the BoJ surprised with a hike – but the core mechanism Cowen highlights is the same: when US policy is moving toward looser conditions just as Japan tightens, the long-running yen carry trade becomes unstable and high-beta assets sell off hard.
Truflation’s thread lays out why this matters for Bitcoin and the wider crypto market. Large institutions and commercial banks “borrow money in Yen where interest rates are historically and famously low, and use that money to invest in the US.” They can park the funds in interest-bearing instruments to “earn healthy 3–4%” on the spread, or “more often, they invest in stocks and bonds to get way more.” This is reinforced by a BoJ policy of keeping the yen cheap against the dollar.
The danger arises when stocks fall and the yen starts to rise or is expected to rise. Then “institutional and Commercial borrowers may exit, so as not to get stuck with significant losses on their Yen debts.” They “sell whatever assets they purchased in the US and get back into Yen to pay back their loans in Japan, resulting in a cascade of US asset sales and Yen purchases.” After “years of Yen carry trade being a relatively safe way for big banks and institutional investors to make easy money,” even a modest normalization can force broad, mechanical de-risking — and Bitcoin, as a liquid, leveraged risk asset, sits directly in that firing line.
Crypto trader Kevin (@Kev_Capital_TA) underscores how tight the current window is. He notes that “we have the Fed’s preferred measure to track inflation via the Core PCE inflation and then the FOMC all in the next six days,” followed by a BoJ press conference on 19 December that will be “massive for Dollar, short end and long end of the yield curve not to mention Yen carry trade fears.” In a separate post, he stresses that “the JP10Y continues to make new highs. Pretty big deal folks,” highlighting that Japanese yields are grinding higher into that meeting and increasing pressure on the BoJ to act.
A few days ago, BitMEX founder Arthur Hayes connected that macro repricing directly to Bitcoin’s latest leg down. “BTC dumped cause BOJ put Dec rate hike in play. USDJPY 155–160 makes BOJ hawkish,” he argues, framing the sell-off as a funding shock rather than a crypto-native event.
Into December, futures and economist surveys put the probability of a Fed cut at roughly 80–87% for the 9–10 December meeting, even as the committee remains divided. At the same time, the BoJ is openly signalling it will “consider the pros and cons” of a hike at its 18–19 December meeting, with markets now pricing a high likelihood of tightening and 10-year JGB yields near multi-decade highs.
That combination — Fed easing expectations plus BoJ tightening risk — is exactly the configuration that threatens the yen carry and makes a repeat of July 2024’s pattern plausible: a sharp flush in Bitcoin and other risk assets, followed by a bottom once forced deleveraging runs its course.
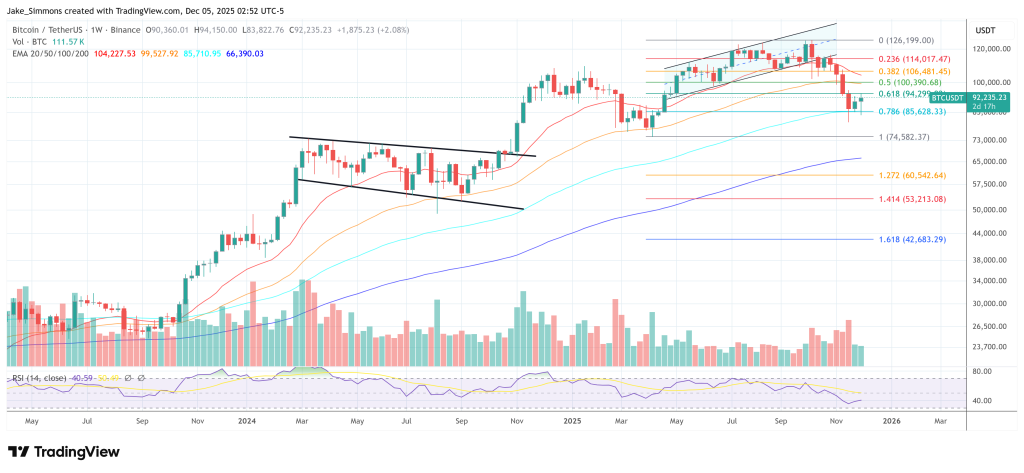
At press time, BTC traded at $92,235.
You May Also Like

Stijgt XRP koers naar niveau eerdere oplevingen door herhaling van candle patronen?

IP Hits $11.75, HYPE Climbs to $55, BlockDAG Surpasses Both with $407M Presale Surge!
