Chainlink price stabilized around the $14 support level as the crypto market rally faded. It has formed a highly bullish chart pattern as LINK ETF inflows soar and as the supply in exchanges drops. Chainlink price chart points to a…Chainlink price stabilized around the $14 support level as the crypto market rally faded. It has formed a highly bullish chart pattern as LINK ETF inflows soar and as the supply in exchanges drops. Chainlink price chart points to a…

Chainlink price eyes rebound as LINK ETF nears $50m milestone as whales buy

2025/12/07 15:17

Chainlink price stabilized around the $14 support level as the crypto market rally faded. It has formed a highly bullish chart pattern as LINK ETF inflows soar and as the supply in exchanges drops.

Summary
  • Chainlink price has formed the bullish falling wedge pattern on the daily chart.
  • The Grayscale LINK ETF has accumulated over $48 million in assets.
  • The Strategic LINK Reserves have crossed the 1 million tokens mark.

Chainlink price chart points to a rebound 

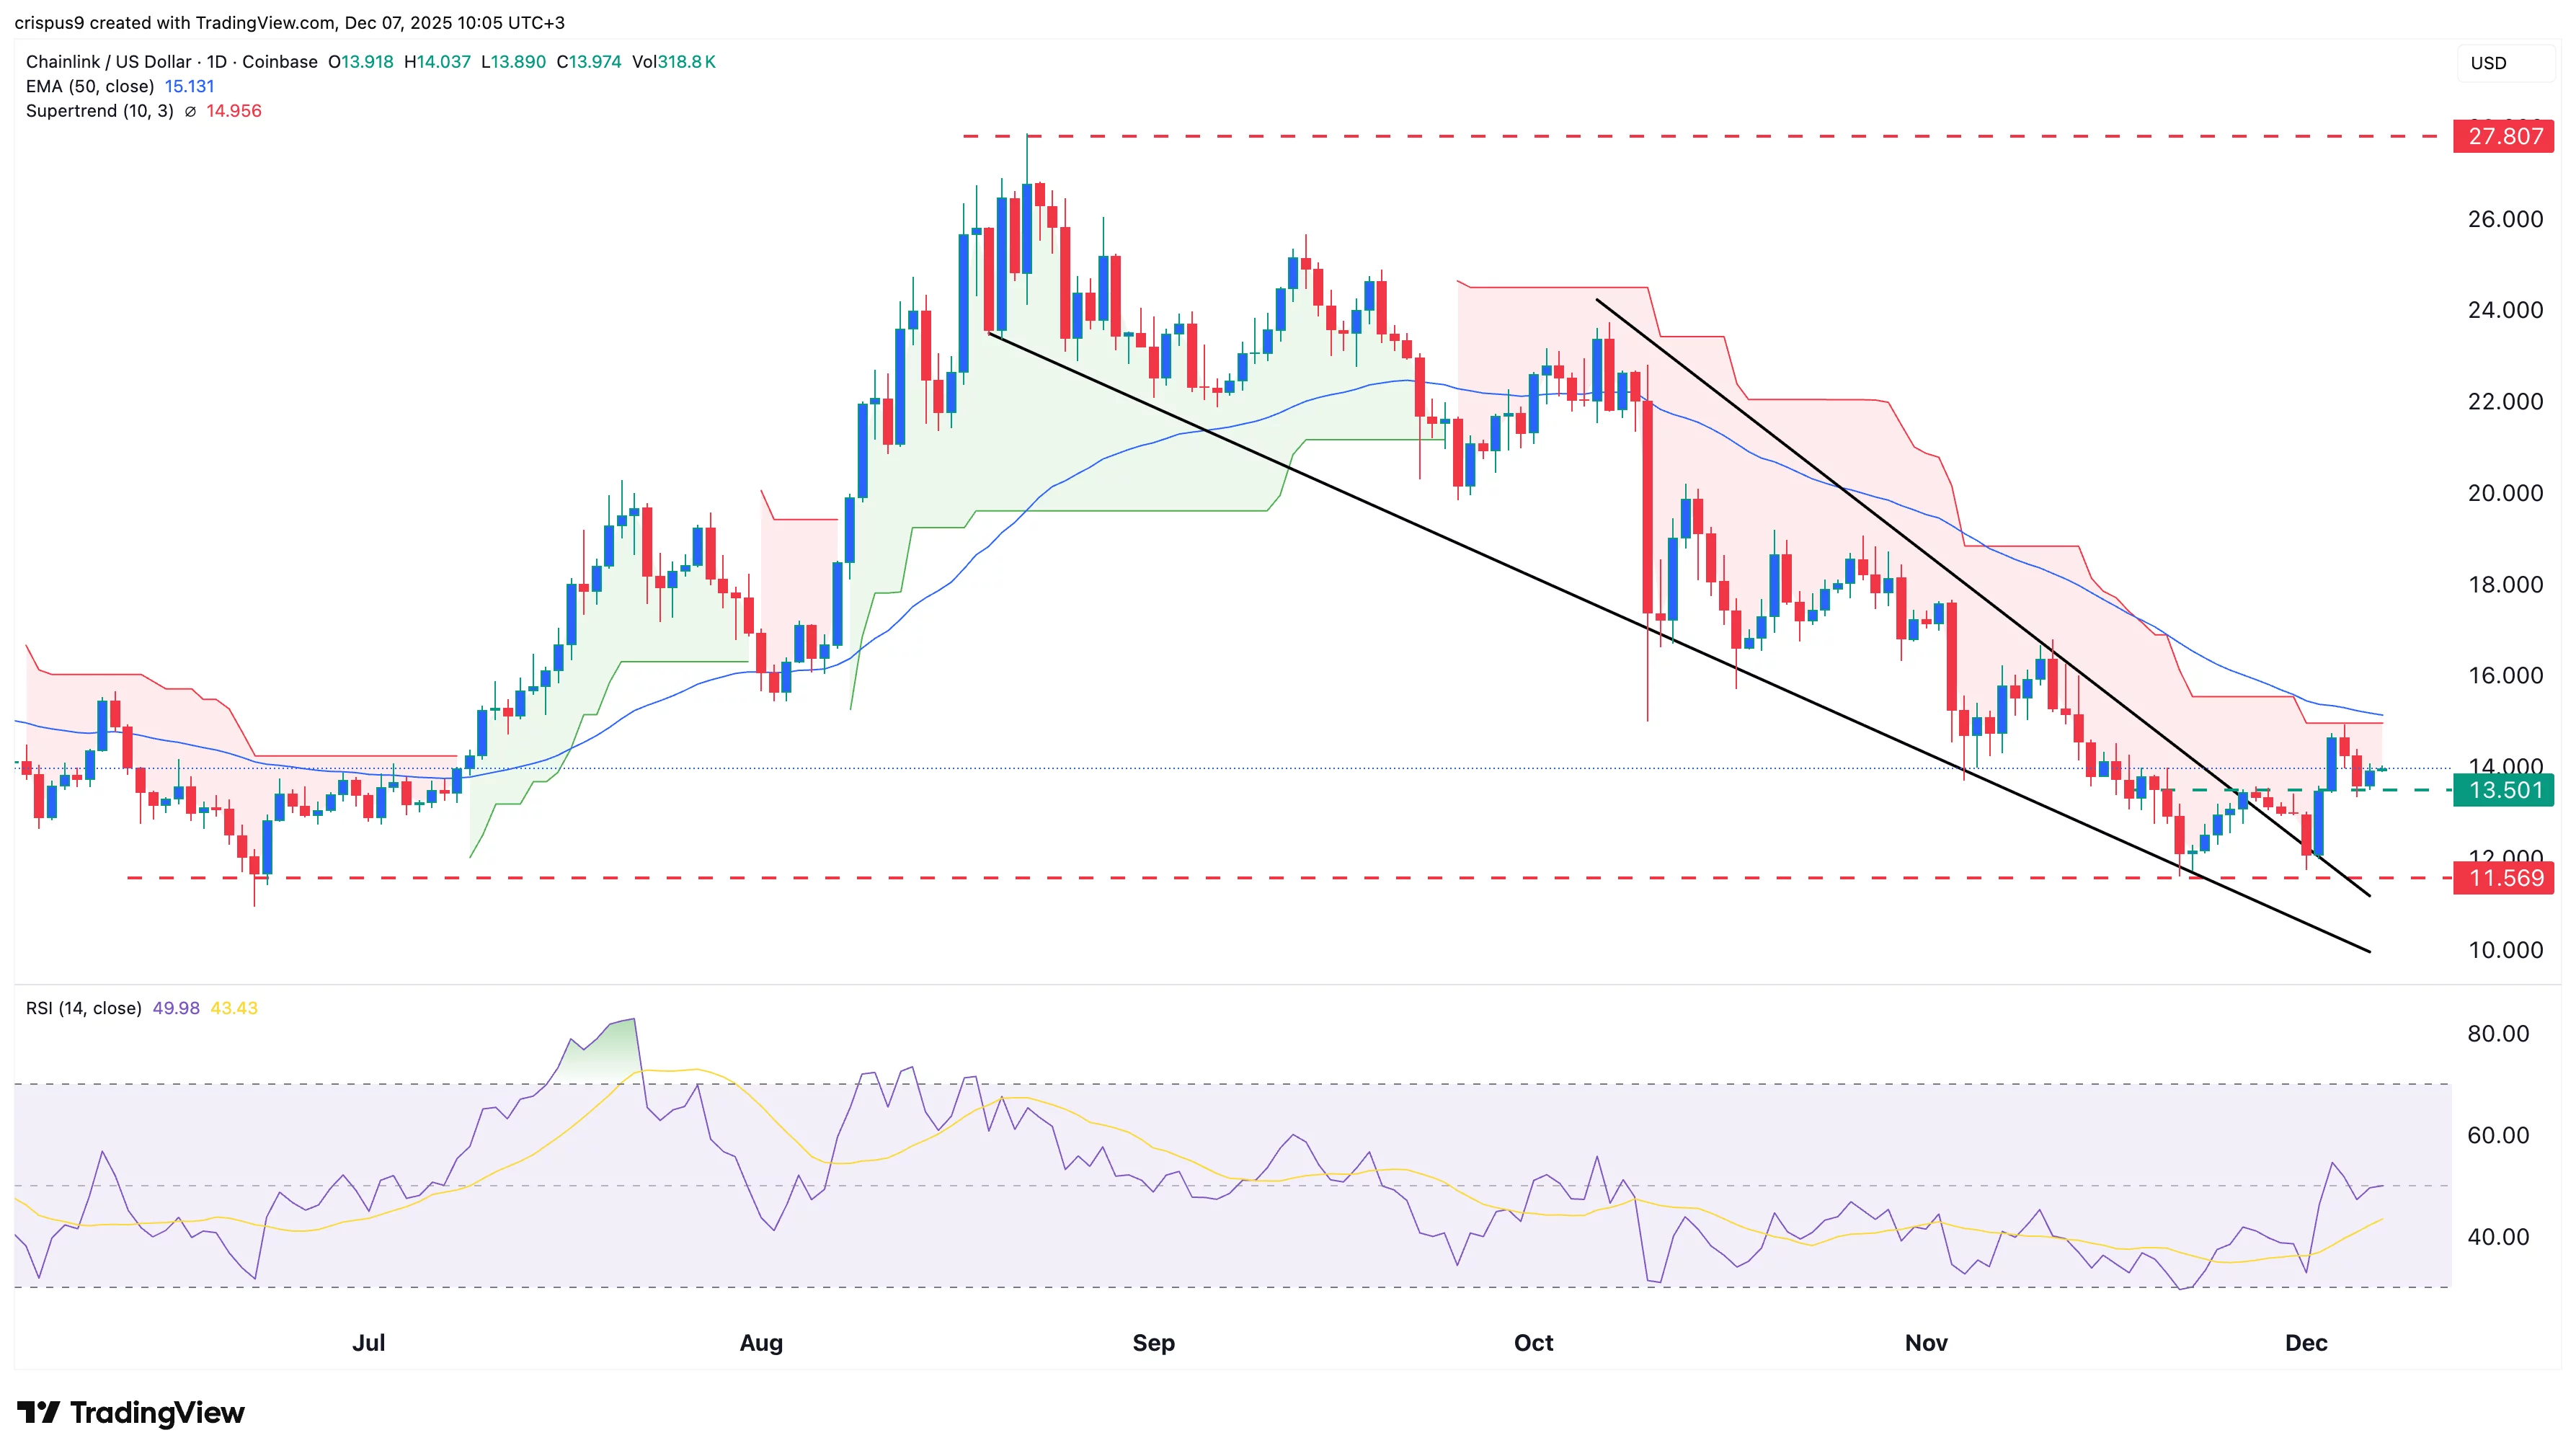
The daily timeframe chart shows that the Chainlink (LINK) price has formed a few highly bullish chart patterns. It formed a double-bottom pattern at $11.56 and a neckline at $13.50. A double-bottom is one of the most common bullish reversal signs in technical analysis.

Chainlink price has also formed a giant falling wedge pattern, which is made up of two descending and converging trendlines. It has already moved above the upper side of the wedge pattern.

The token is also about to move above that Supertrend indicator, a sign that the bullish breakout is happening. It is also about to move above the 50-day moving average. 

Therefore, the token will likely continue rising as bulls target the next key resistance level at $20, up by 45% above the current level. A drop below the key support at $11.56 will invalidate the bullish outlook.

Chainlink price

LINK ETFs near $50 million milestone 

The main catalyst for the Chainlink price is that the top LINK ETF has been received well by market participants. Data compiled by SoSoValue shows that the spot LINK ETF had inflows in all days since it was launched.

The fund had over $48 million in assets, bringing its assets to over $70.6 million, representing 0.75% of its market capitalization. This means that it has more gains to go in the coming months as it targets the 5% value that Bitcoin and Ethereum have.

Meanwhile, there are signs that the supply of LINK tokens in exchanges has continued falling in the past few months. Data shows that the supply stands at 218 million, down from the November high of 264 million.

LINK exchange supply

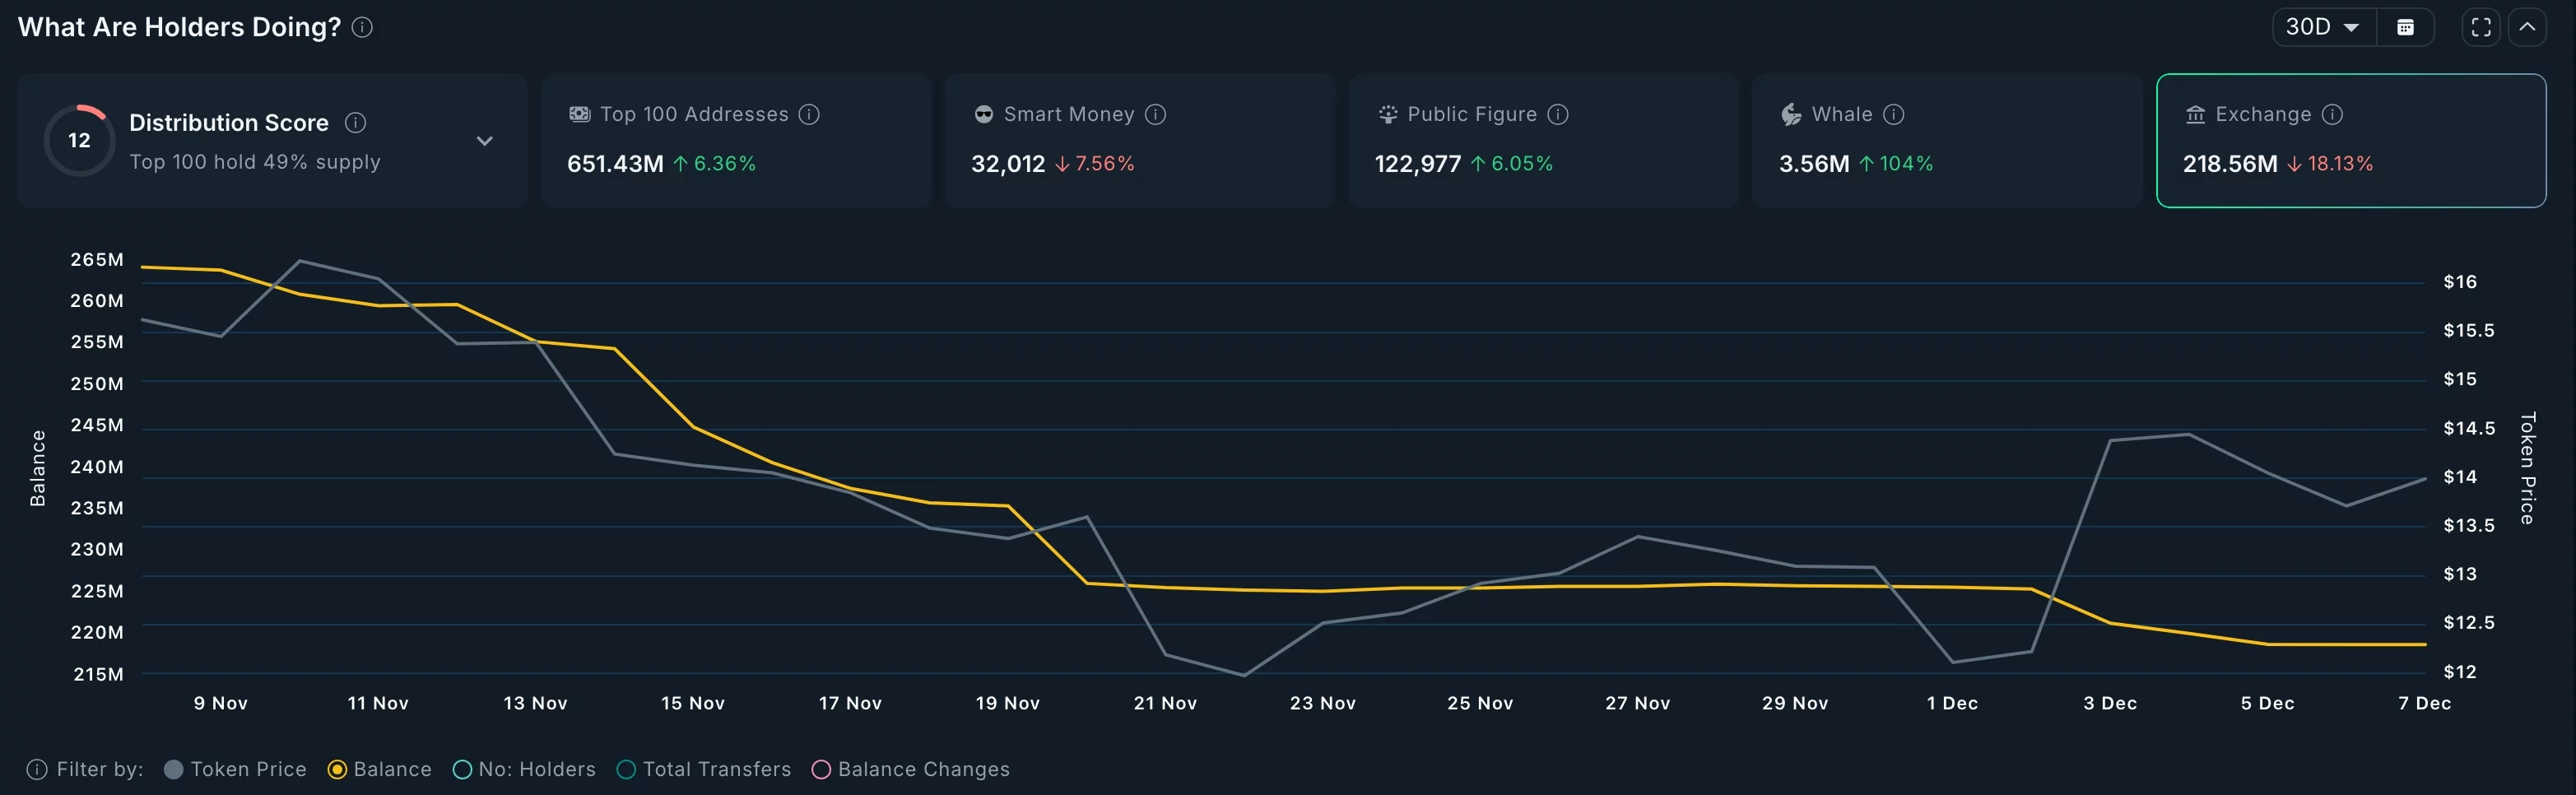
At the same time, whales have continued accumulating their tokens. Data shows that these whales now hold 3.56 million tokens, up from 1.73 million tokens in November, a sign that demand is soaring.

Mode data shows that the Chainlink team is continuing to accumulate tokens as part of the Strategic LINK Reserves. The amount of tokens in these reserves has jumped to 1 million, worth about $14.7 million, a few months after launch. 

Strategic LINK reserves assets

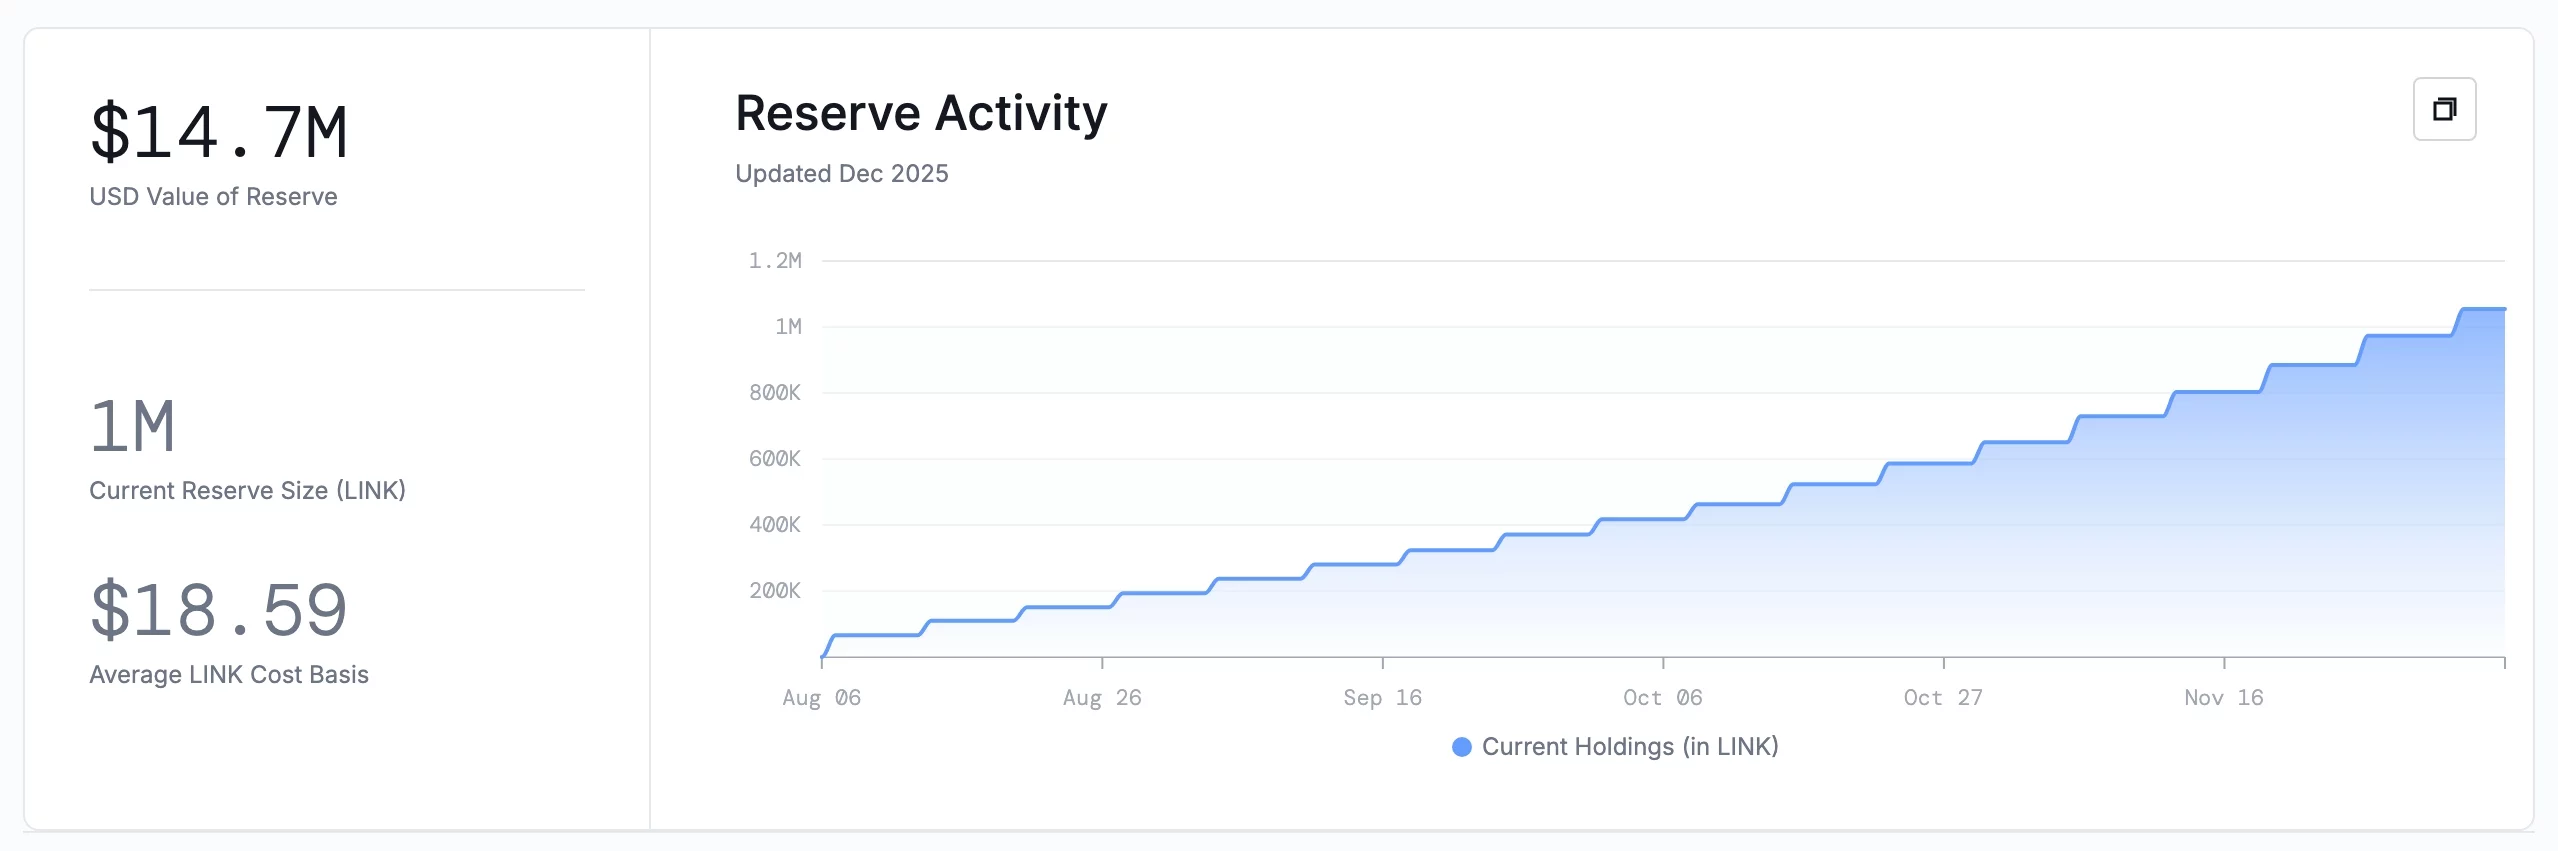
Chainlink started accumulating the tokens in August, channelling the fees it makes from the network to these purchases.

Disclaimer: The articles reposted on this site are sourced from public platforms and are provided for informational purposes only. They do not necessarily reflect the views of MEXC. All rights remain with the original authors. If you believe any content infringes on third-party rights, please contact service@support.mexc.com for removal. MEXC makes no guarantees regarding the accuracy, completeness, or timeliness of the content and is not responsible for any actions taken based on the information provided. The content does not constitute financial, legal, or other professional advice, nor should it be considered a recommendation or endorsement by MEXC.

You May Also Like

Stijgt XRP koers naar niveau eerdere oplevingen door herhaling van candle patronen?

Stijgt XRP koers naar niveau eerdere oplevingen door herhaling van candle patronen?

XRP toont opnieuw een bekend patroon op hogere tijdsframes. Een analyse van EGRAG Crypto laat zien dat het token voor de derde keer in dezelfde demandzone beweegt waar eerder sterke candles ontstonden. In voorgaande situaties kochten de bulls binnen korte tijd de koersdaling op, waardoor deze candles lange wicks vormden. Dit keer verschijnt dezelfde structuur. Kan de XRP koers hierdoor binnenkort weer herstellen? Check onze Discord Connect met "like-minded" crypto enthousiastelingen Leer gratis de basis van Bitcoin & trading - stap voor stap, zonder voorkennis. Krijg duidelijke uitleg & charts van ervaren analisten. Sluit je aan bij een community die samen groeit. Nu naar Discord XRP koers beweegt rond herkenbare marktstructuur EGRAG verwijst naar twee eerdere momenten waarop het XRP token de onderkant van een consolidatiezone aantikte. Beide keren ontstond er een krachtige candle die daarna door een reeks groene candles werd gevolgd. Dit is zichtbaar op de 5-daagse grafiek, waar de XRP markt zich al langere tijd in een horizontale structuur beweegt. Het token zakte onlangs terug richting een bekend prijsbereik dat eerder als demandzone fungeerde. In die eerdere gevallen kochten de bulls die koersdaling snel op. De candles vormden hierdoor lange wicks en de voortzetting hiervan leverde koersbewegingen op die weken aanhielden. In de huidige test is opnieuw een vergelijkbare reactie zichtbaar. De XRP prijs viel kort onder een belangrijke grens en stabiliseerde direct daarna, wat aansluit bij eerdere patronen volgens de grafiek. Op kortere tijdframes, zoals de 2-uurs grafiek, laat het token een andere dynamiek zien. De koersdaling die meerdere dagen aanhield, is nu in een zijwaartse fase overgegaan. Die compressie ontstaat wanneer het volume afneemt en de bears de verkoopdruk niet verder kunnen duwen. Dit is een controleerbare observatie, omdat de candles kleiner worden en de wicks aan beide kanten toenemen. Dit soort prijsactie kwam ook voor bij de eerdere twee XRP oplevingen. De markt schoof toen zijwaarts voordat een grotere koersbeweging ontstond. Volgens EGRAG is de huidige XRP structuur daarom vergelijkbaar met eerdere situaties die tot sterke candles leidden. #XRP – 5D Time Frame : Candle ️1 or Candle ️2..… which outcome plays out next? Both past instances show strong demand stepping in at local support zone , but one scenario has a slightly higher probability this time. I’m leaning toward one over the other…..Share your… pic.twitter.com/iW0ii2Haoz — EGRAG CRYPTO (@egragcrypto) December 6, 2025 Welke crypto nu kopen?Lees onze uitgebreide gids en leer welke crypto nu kopen verstandig kan zijn! Welke crypto nu kopen? De langste government shutdown in de geschiedenis van de VS is eindelijk achter de rug. Dat zorgt ervoor dat er eindelijk weer vooruitgang geboekt kan worden. Dit is erg bullish voor crypto, en dus gaan wereldberoemde traders ineens all-in op altcoins als XRP. Eén vraag komt telkens terug: welke crypto moet… Continue reading Stijgt XRP koers naar niveau eerdere oplevingen door herhaling van candle patronen? document.addEventListener('DOMContentLoaded', function() { var screenWidth = window.innerWidth; var excerpts = document.querySelectorAll('.lees-ook-description'); excerpts.forEach(function(description) { var excerpt = description.getAttribute('data-description'); var wordLimit = screenWidth wordLimit) { var trimmedDescription = excerpt.split(' ').slice(0, wordLimit).join(' ') + '...'; description.textContent = trimmedDescription; } }); }); XRP koers toont kenmerken van een mogelijk hernieuwd patroon De crypro-analist benadrukt verder dat beide scenario’s technisch mogelijk zijn. In de eerdere XRP oplevingen waren bepaalde elementen duidelijk aanwezig. De bulls kochten op dezelfde prijszone, de candles kregen lange wicks en de volgende candle toonde een duidelijke voortzetting. Omdat diezelfde combinatie opnieuw zichtbaar wordt, acht EGRAG één van de scenario’s iets waarschijnlijker dan het andere, al maakte hij nog niet bekend welk scenario hij zelf kiest. Het afnemende XRP volume is een merkbaar signaal. Wanneer het volume daalt bij een bekend support niveau, betekent dit dat de bears minder verkoopdruk uitoefenen. Het trading bereik vernauwt en de candles verliezen kracht. Dit soort volume compressies kan volgens eerdere patronen leiden tot een grotere koersbeweging zodra er een nieuwe groene candle ontstaat. In de huidige grafiek ligt daarom de nadruk op de candle die de support zone respecteert. De reactie daarop bepaalt dan of het patroon dat eerder zichtbaar was opnieuw vorm krijgt. EGRAG geeft aan dat hij later op de dag bekendmaakt welk scenario hij als voorkeursstructuur ziet. Alles draait bij XRP op dit moment om twee mogelijke uitwerkingen. De eerste mogelijkheid is dat de markt een sterke candle neerzet vanaf de demandzone, vergelijkbaar met de eerdere oplevingen. De tweede mogelijkheid is dat er een zwakkere candle ontstaat die de XRP markt in een langere zijwaartse fase duwt. Beide uitkomsten zijn terug te vinden in de historische grafiek informatie, waardoor ze controleerbaar zijn. XRP beweegt op dit moment rond $2.05, dicht bij het prijsniveau waar eerder vraag ontstond. Dat maakt deze prijszone opnieuw relevant. De candles laten zien dat de verkoopdruk afneemt en dat de XRP markt op dezelfde plek steun vindt waar eerder grotere koersbewegingen begonnen. Wat wordt de komende beweging van de XRP koers? XRP bevindt zich opnieuw op een plek waar de markt eerder sterke oplevingen zag. De candles, het volume en de structuur lijken sterk op de eerdere twee momenten waarop het token vanaf dezelfde prijszone omhoog bewoog. De komende candles bepalen of dit patroon opnieuw zichtbaar wordt. Het belangrijkste gegeven is dat de grafiek laat zien dat dezelfde XRP marktstructuur opnieuw ontstaat. Best wallet - betrouwbare en anonieme wallet Best wallet - betrouwbare en anonieme wallet Meer dan 60 chains beschikbaar voor alle crypto Vroege toegang tot nieuwe projecten Hoge staking belongingen Lage transactiekosten Best wallet review Koop nu via Best Wallet Let op: cryptocurrency is een zeer volatiele en ongereguleerde investering. Doe je eigen onderzoek. Het bericht Stijgt XRP koers naar niveau eerdere oplevingen door herhaling van candle patronen? is geschreven door Dirk van Haaster en verscheen als eerst op Bitcoinmagazine.nl.
Share
Coinstats2025/12/07 23:16
IP Hits $11.75, HYPE Climbs to $55, BlockDAG Surpasses Both with $407M Presale Surge!

IP Hits $11.75, HYPE Climbs to $55, BlockDAG Surpasses Both with $407M Presale Surge!

The post IP Hits $11.75, HYPE Climbs to $55, BlockDAG Surpasses Both with $407M Presale Surge! appeared on BitcoinEthereumNews.com. Crypto News 17 September 2025 | 18:00 Discover why BlockDAG’s upcoming Awakening Testnet launch makes it the best crypto to buy today as Story (IP) price jumps to $11.75 and Hyperliquid hits new highs. Recent crypto market numbers show strength but also some limits. The Story (IP) price jump has been sharp, fueled by big buybacks and speculation, yet critics point out that revenue still lags far behind its valuation. The Hyperliquid (HYPE) price looks solid around the mid-$50s after a new all-time high, but questions remain about sustainability once the hype around USDH proposals cools down. So the obvious question is: why chase coins that are either stretched thin or at risk of retracing when you could back a network that’s already proving itself on the ground? That’s where BlockDAG comes in. While other chains are stuck dealing with validator congestion or outages, BlockDAG’s upcoming Awakening Testnet will be stress-testing its EVM-compatible smart chain with real miners before listing. For anyone looking for the best crypto coin to buy, the choice between waiting on fixes or joining live progress feels like an easy one. BlockDAG: Smart Chain Running Before Launch Ethereum continues to wrestle with gas congestion, and Solana is still known for network freezes, yet BlockDAG is already showing a different picture. Its upcoming Awakening Testnet, set to launch on September 25, isn’t just a demo; it’s a live rollout where the chain’s base protocols are being stress-tested with miners connected globally. EVM compatibility is active, account abstraction is built in, and tools like updated vesting contracts and Stratum integration are already functional. Instead of waiting for fixes like other networks, BlockDAG is proving its infrastructure in real time. What makes this even more important is that the technology is operational before the coin even hits exchanges. That…
Share
BitcoinEthereumNews2025/09/18 00:32
Why Ethereum strengthens despite whale selling – Inside Asia premium twist

Why Ethereum strengthens despite whale selling – Inside Asia premium twist

The post Why Ethereum strengthens despite whale selling – Inside Asia premium twist appeared on BitcoinEthereumNews.com. Ethereum’s cohort behavior continues to shape market expectations, but this time the signals are mixed. Over the past day, Ethereum [ETH] has maintained a neutral stance, showing neither strong bullish nor bearish dominance, and is currently trading at $3,033 at press time. Price could, however, make a decisive move as new patterns emerge. This cohort remains a strong influence on price Wallets holding 1,000–10,000 ETH remained the most bearish and pushed price lower after ETH crossed $5,000. Their steady sell-off increased circulating supply and reinforced the recent downtrend. By contrast, wallets holding 10,000–1 million ETH stayed relatively inactive through this period, showing no aggressive accumulation or distribution. Source: Alphractal The Heatmap showed ongoing silent distribution across cohorts. This trend may delay a strong directional shift unless a larger buyer group reappears. U.S. and Asian investors share a similar outlook U.S. and Korean investors are currently showing similar behavior towards Ethereum. While on-chain data indicated that distribution has largely taken place, silent accumulation has continued among these groups, particularly among U.S. investors. U.S. investors appear to be the most bullish. This trend was tracked using the Coinbase Premium Index. Since the 1st of December, this group has quietly accumulated Ethereum from the market. The index moved from -0.02 to a positive level of 0.03 and continued to trend upward at press time, suggesting ongoing accumulation and a strong possibility that the trend could persist. Source: CryptoQuant Similarly, Korean investors continue to display the same pattern via the Korea Premium Index. This index has stayed above 1 as these investors continue accumulating since September. However, buying pressure has gradually weakened, as indicated by the downward trend in the chart line. This suggests that investors are reducing exposure slightly, while still maintaining a generally bullish outlook. Reserve trend supports a bullish narrative Investors…
Share
BitcoinEthereumNews2025/12/08 00:08