Pudgy Penguins (PUDGY) Price Prediction 2025–2029: Can PUDGY Break $0.015 Soon?
- Pudgy Penguins (PUDGY) stabilizes as tightening volatility hints at a major breakout soon.
- PUDGY nears crucial support levels while traders await a decisive momentum shift ahead.
- Technical indicators show consolidation, suggesting Pudgy Penguins is preparing for significant movement.
Pudgy Penguins (PUDGY) is currently trading around $0.01147 as it stabilizes after several weeks of bearish pressure. The narrowing volatility, neutral RSI, and constricting Bollinger Bands suggest that the market is preparing for a breakout. With momentum slowing and the price hovering near its lower support zone, traders are closely monitoring whether PUDGY will initiate a recovery or continue its downward drift. The asset’s modest 3.33% increase in the last 24 hours indicates early signs of strengthening, but it’s not yet enough to confirm a trend reversal.
Pudgy Penguins is at a crucial juncture. As the broader crypto market attempts to stabilize, maintaining support levels could determine whether PUDGY resumes its consolidation pattern or begins an upward trend. The price action shows indecision in the market, and all indicators suggest that traders are waiting for a strong catalyst.
Also Read: Terra Classic (LUNC) Price Prediction 2025–2029: Will LUNC Hit $0.0001 Soon?
Technical Analysis
Bollinger Bands
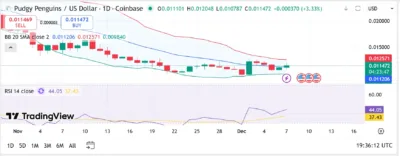
The Bollinger Bands on the daily chart present a notable tightening pattern, with the upper band positioned near $0.01257, the middle band at $0.01147, and the lower band at $0.00984. PUDGY is currently trading beneath the middle band, reflecting a neutral-to-bearish sentiment in recent sessions. Historically, when prices remain compressed beneath the middle band, buyers tend to wait for clearer signals before making large commitments.
Should PUDGY rise above the middle band at $0.01147, it could signify the start of a bullish attempt to test the upper band at $0.01257. A breakout above that level would likely shift market sentiment toward optimism, potentially pushing PUDGY toward the $0.013 mark. On the other hand, if the price falls below the lower band at $0.00984, it could trigger further selling pressure, potentially pushing PUDGY toward the $0.009 price zone.
The narrowing of the bands suggests that the market is preparing for a substantial move. Until that breakout occurs, the asset is likely to remain within its consolidation range.
RSI Behavior
The Relative Strength Index (RSI) is currently at 44.05, indicating neutral market conditions. The RSI is neither in an overbought nor oversold zone, reflecting balanced market conditions where neither buyers nor sellers have full control. This neutral stance suggests that the asset may either continue to consolidate or begin an upward reversal should momentum shift in favor of buyers.
Breaking above the 50 mark on the RSI would be a strong sign of bullish intent, while a decline toward 30 could confirm ongoing bearish sentiment. The current RSI level indicates that PUDGY may experience some upward momentum, but it’s still too early to declare a full trend reversal.
Support and Resistance Levels
Pudgy Penguins has immediate support near the lower Bollinger Band at $0.00984, a level that has proven resilient in recent declines. This could serve as an accumulation zone for traders looking for a potential bounce. Resistance sits at the middle Bollinger Band at $0.01147, which must be broken for a bullish rally to gain momentum. The more significant resistance is at the upper Bollinger Band, around $0.01257, where PUDGY would likely face further challenges.
If PUDGY fails to hold above the $0.00984 support level, the price could slide into a deeper correction, possibly testing $0.0090. However, a breakout above resistance at $0.01147 and $0.01257 would indicate renewed bullish enthusiasm, setting the stage for further gains.
Source: Tradingview
Pudgy Penguins (PUDGY) Price Predictions (2025–2029)
| Year | Minimum Price | Average Price | Maximum Price |
| 2025 | $0.0090 | $0.0115 | $0.0150 |
| 2026 | $0.0120 | $0.0150 | $0.0200 |
| 2027 | $0.0150 | $0.0180 | $0.0250 |
| 2028 | $0.0200 | $0.0250 | $0.0300 |
| 2029 | $0.0250 | $0.0300 | $0.0350 |
2025
Pudgy Penguins is expected to move within a price range of $0.009 to $0.015 throughout 2025. With tightening Bollinger Bands and a neutral RSI, PUDGY is likely to experience significant movement once a clear momentum shift occurs. If the asset can break above the $0.01257 resistance, the price may reach $0.015 in the short term.
2026
By 2026, Pudgy Penguins could see broader market adoption and increased interest from both retail and institutional investors. The average price could be around $0.015, with the potential for highs near $0.020 as PUDGY attracts more attention.
2027
In 2027, the Pudgy Penguins project may see a more significant boost as the NFT market matures, and investor confidence in unique assets like PUDGY rises. The price could average around $0.018, with the potential for a push toward $0.025 if momentum continues to build.
2028
By 2028, Pudgy Penguins may solidify its place within the NFT ecosystem. A wider acceptance of NFTs and decentralized applications could see the price of PUDGY rise to the $0.020 to $0.030 range, with significant interest from collectors and long-term holders.
2029
Looking to 2029, Pudgy Penguins could potentially exceed $0.030, with a maximum price of $0.035, assuming market conditions remain favorable and adoption continues to expand. The asset’s longevity and strong community backing may help it reach new heights, cementing its position in the crypto space.
Conclusion
Pudgy Penguins is currently navigating a consolidation phase marked by tightening Bollinger Bands and a neutral RSI. These conditions often precede a major price movement, and the market is waiting for a catalyst. If PUDGY manages to break above its $0.01147 resistance level, the asset could enter a new bullish cycle.
Over the long term, the outlook for Pudgy Penguins remains positive. With continued development and increased market awareness, PUDGY could see steady growth, with the potential to reach the $0.025 to $0.035 range by 2029.
FAQs
1. What is the current market sentiment for Pudgy Penguins (PUDGY)?
The market sentiment for Pudgy Penguins is currently neutral-to-bearish, with the RSI sitting near the lower neutral boundary and the tightening Bollinger Bands indicating a potential surge in volatility.
2. Can Pudgy Penguins break above the $0.015 mark in 2025?
Yes, Pudgy Penguins can break above $0.015 if it holds support at $0.00984 and manages to break through resistance at $0.01147 and $0.01257.
3. How should traders approach PUDGY at its current price?
Traders should monitor whether PUDGY breaks above $0.01147 or falls below $0.00984. These levels are crucial in determining the next direction of the market.
4. How does Pudgy Penguins compare to other NFTs and crypto assets?
Pudgy Penguins stands out in the NFT space due to its strong community and market presence. It offers stability and growth potential, especially as the NFT market continues to mature.
5. What is the price prediction for Pudgy Penguins in 2029?
By 2029, Pudgy Penguins could reach between $0.030 and $0.035, assuming continued market support and adoption of NFTs.
Also Read: Toncoin (TON) Price Prediction 2025–2029: Can TON Break Above $2.00 Soon?
The post Pudgy Penguins (PUDGY) Price Prediction 2025–2029: Can PUDGY Break $0.015 Soon? appeared first on 36Crypto.
You May Also Like

Short-Term Bitcoin Profits Dominate For The First Time Since 2023

OKX founder responds to Moore Threads co-founder 1,500 BTC debt