

Apple Stock tests key $296 support after WWDC AI hype fades

Apple stock is at a technical crossroads following the recent WWDC AI reveal. After a strong recovery into the $310–$317 range, AAPL faced a sharp reversal Monday, closing at $301.54 as sell-the-news pressure took hold.
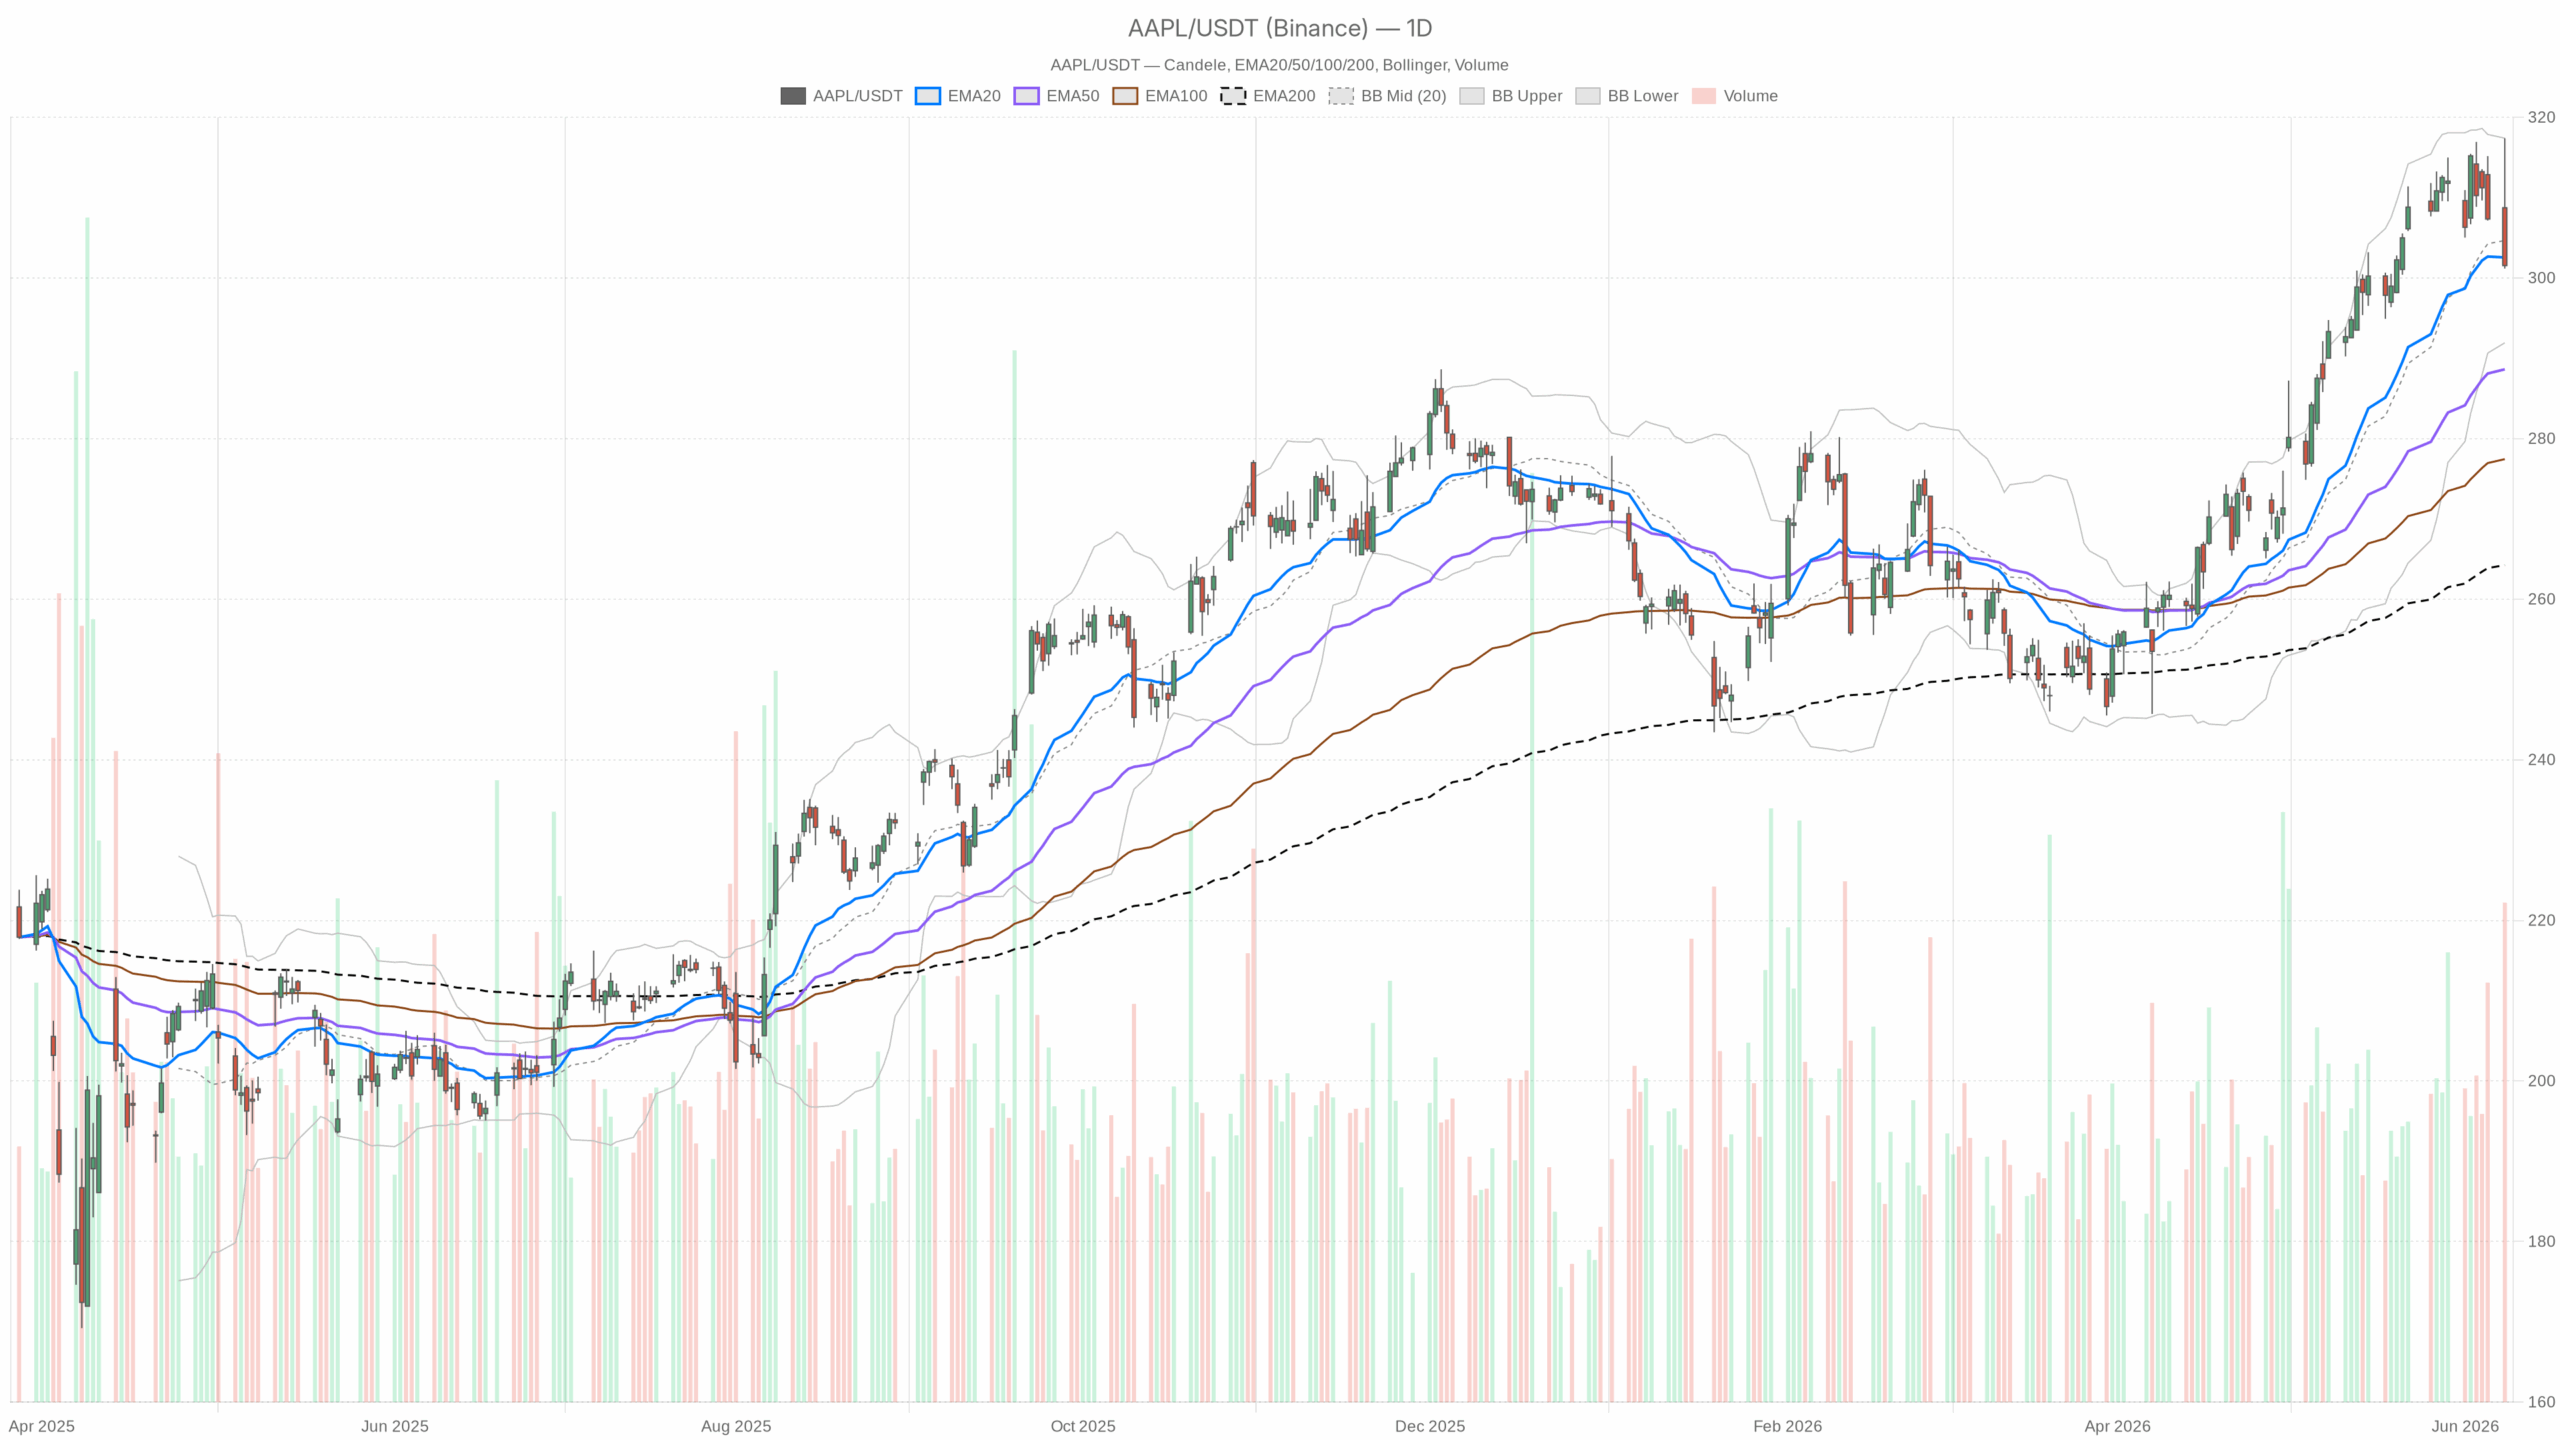 AAPL — daily chart with candlesticks, EMA20/EMA50 and volume.
Apple Stock Faces Short-Term Sell-the-News Pressure
Monday’s session delivered a decisive reversal for Apple shares, erasing early gains in response to the WWDC AI announcements. Despite the overhauled Siri and expanded Apple Intelligence platform, markets had largely priced in the event. This sell-the-news dynamic now shapes the short-term outlook for Apple stock.
Daily Technical Analysis: Signs of Momentum Fading
Key Bollinger and EMA Signals
On the daily chart, Apple closed below both the Bollinger Band midpoint at $304.66 and the 20-day EMA at $302.55, after hitting the upper Bollinger Band at $317.40. This rejection at the band’s upper boundary signals exhaustion following the recent rally, suggesting a shift from bullish momentum toward consolidation or a pullback phase.
Trend Context and Momentum Indicators
Despite this, the daily EMA stack remains bullish, with the 20-day EMA above the 50-day and the 50-day comfortably above the 200-day. These moving averages provide strong dynamic support well below current price levels. The daily RSI at 53.29 confirms a neutral stance—momentum is off overbought levels but the medium-term uptrend holds without strong conviction. Meanwhile, the daily MACD line crossed below its signal line, producing a slightly negative histogram at -1.62. This mild caution indicates fading buying pressure while overall momentum remains constructive.
Daily Pivot and Price Range Dynamics
Price closed Monday below the daily pivot at $306.70, settling in the lower half of its near-term range. Resistance lies at $312.24, with support at $296.01. Holding above $296 is critical to maintain the short-term bullish thesis. Failure to reclaim $306.70 or break below $296 could signal a deeper pullback.
Hourly Timeframe Reveals Clearer Bearish Signals
EMA and Bollinger Band Breakdown
AAPL trades well below the hourly 20- and 50-EMAs near $309.5, contrasting sharply with the daily bullish alignment. The price broke below the hourly Bollinger Band lower boundary at $303.35, closing at $301.57, a notable bearish indicator.
Momentum and Support at the Hourly Level
The hourly RSI at 32.04 nears oversold territory, highlighting aggressive downside pressure. The MACD is also decisively negative. Yet, the 1-hour 200 EMA at $298.43 offers a key structural support that has held previously and may attract dip buyers if tested.
Intraday Execution Context: Oversold and Bearish on 15 Minutes
Short-term momentum is more stretched. The 15-minute RSI stands at 26.65, clearly oversold. Price trades below all short-term EMAs (20, 50, 200), and the MACD histogram remains negative. This setup suggests that any bounce is likely a relief rally rather than a directional reversal unless confirmed by higher timeframes.
Fundamental Catalyst: Analyst Views on Apple Stock Post-WWDC
The WWDC AI announcements have drawn mixed but generally bullish analyst reactions. Wedbush keeps an Outperform rating with a $400 target, signaling long-term optimism around Apple’s AI prospects. Evercore ISI echoed this stance. However, Seeking Alpha favors a Hold rating, noting valuation and regulatory risks despite solid fundamentals. This consensus indicates the current market selloff is more about positioning than fundamental reassessment.
Scenarios for Apple Stock: Bullish vs. Bearish Outcomes
Bullish Path
Apple needs to stabilize above the $296–$298 support zone, anchored by the daily S1 pivot and hourly 200 EMA. A reclaim of the daily 20 EMA and pivot at $306.70 would suggest renewed buying control. Positive developer feedback on the AI platform could fuel this momentum, potentially driving shares toward Wedbush’s $400 target — roughly 33% upside from current levels.
Bearish Path
Conversely, if Apple remains below the daily 20 EMA and drops beneath $296, it could trigger a retest of the 50-day EMA near $288.62. The hourly bearish momentum may intensify, especially if developers’ reception to AI Siri underwhelms. A move to the $290 area would mark material weakening of the daily trend.
Conclusion: Key Levels to Watch in Apple Stock
Apple stock currently balances between a medium-term uptrend and short-term reversal pressures following WWDC. While the daily timeframe signals fading momentum, the overall trend endures. The hourly and 15-minute charts clearly show bearish execution risk amid elevated volatility. With a daily ATR of $6.48, wide price swings remain likely. Therefore, patience is essential. The $296 support and $307 resistance will define AAPL’s next directional move.


추천 콘텐츠

The Best Skills to Monetize From Home This Year

Phemex Publishes April 2026 Proof of Reserves, Reporting 131% Total Reserve Ratio

Best Crypto Presales to Buy in 2026 as Bitcoin Stabilizes


인기 뉴스
더보기
