

RTX Stock Has a $271 Billion Backlog and a 19% Drawdown. Does the Defense Supercycle Justify Buying at $186?
Key Stats for RTX Stock
- 52-Week Range: $140.47-$214.50
- Current Price: $181.83
- Street Mean Target: ~$216
- TIKR Model Target: ~$219
- Q1 2026 Revenue: $22.1B (+9% YoY, +10% organically)
- Q1 2026 Adjusted EPS: $1.78 (+21% YoY)
- FY2026 FCF Guidance: $8.25–$8.75B
- Company Backlog: $271B
Now Live: Discover how much upside your favorite stocks could have using TIKR’s new Valuation Model (It’s free) >>>
A Record Backlog, a February Peak, and a Long Road Back
RTX Corporation (RTX) peaked near $213 in February, as NATO defense spending commitments and a string of contract wins pushed the stock to an all-time high. Then came the tariff selloff and a Q1 earnings report that beat on every line yet still sent shares lower.
The stock has clawed back to $185.60 but remains about 13% below its February peak, with a max drawdown of 19% on May 15.
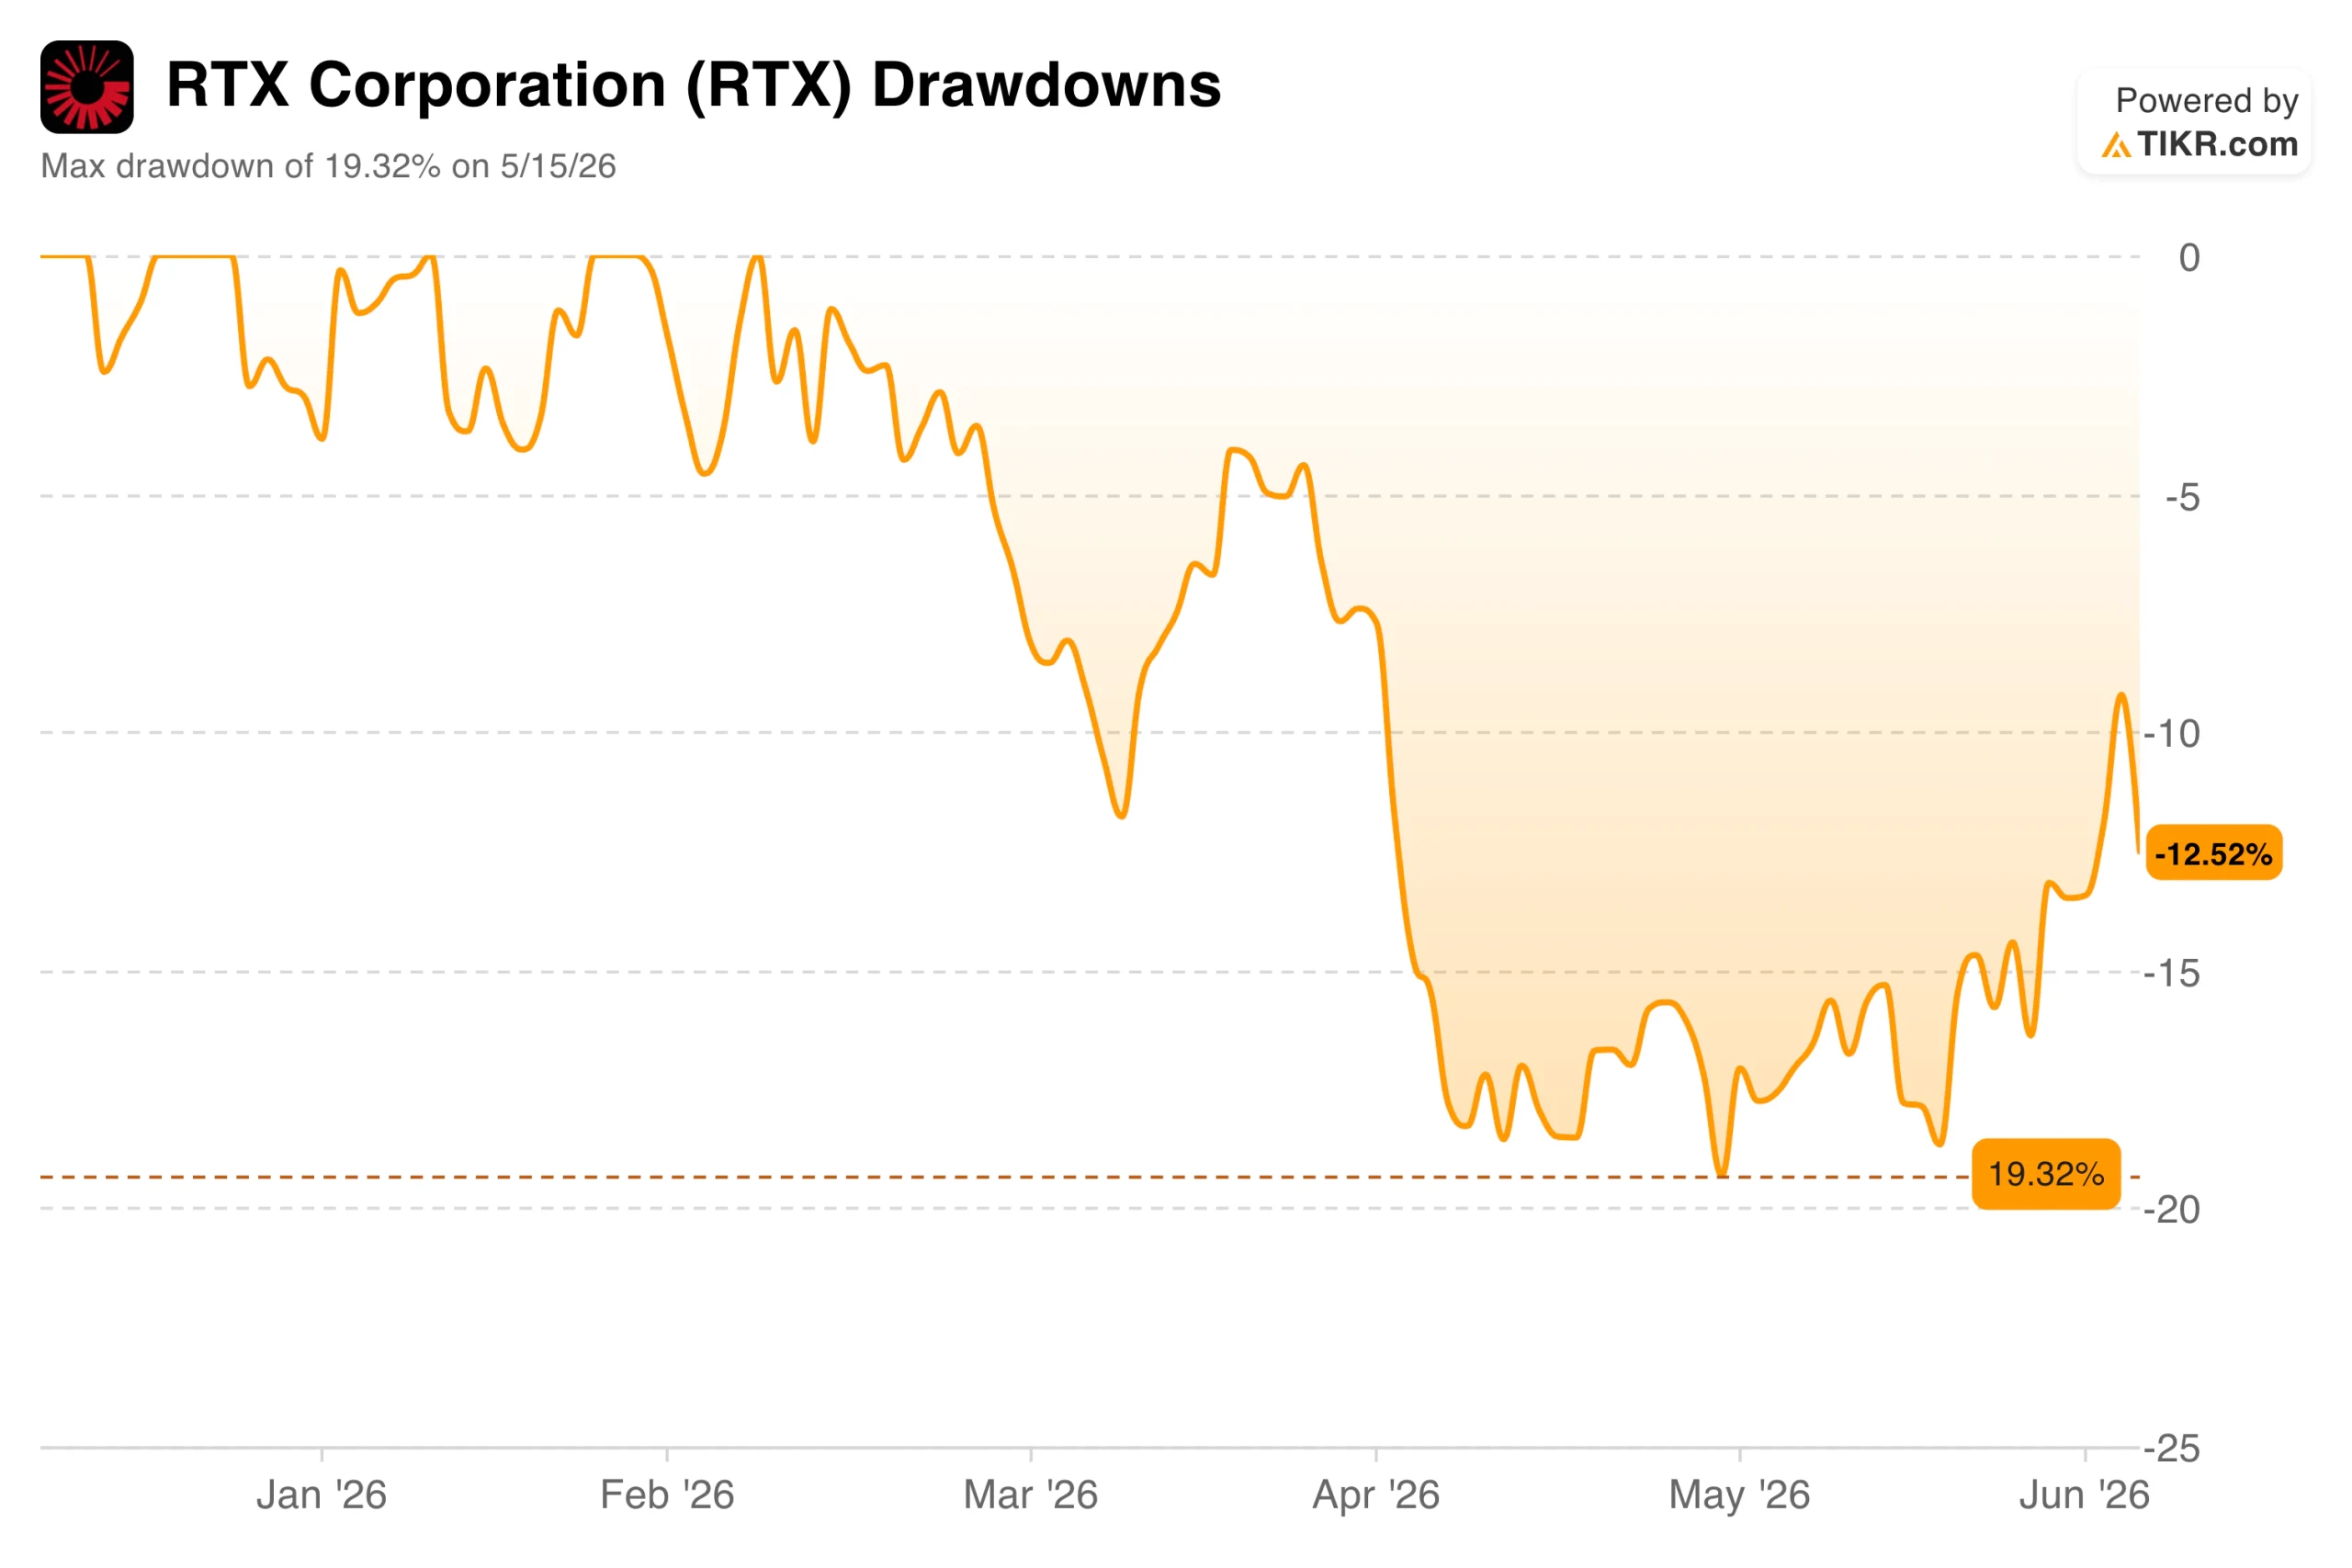 RTX Corporation Drawdowns. (TIKR)
The operational picture is the opposite of what the drawdown chart suggests. First quarter revenue came in at $22.1 billion, up 9% year over year and 10% organically. Adjusted EPS of $1.78 beat consensus by 17% and grew 21% over the prior year.
The company raised its full-year adjusted EPS guidance to between $6.70 and $6.90 and confirmed free cash flow guidance of $8.25 to $8.75 billion. The backlog stood at $271 billion at quarter-end, split between $162 billion in commercial and $109 billion in defense.
See historical and forward estimates for RTX stock (It’s free!) >>>
3 Segments, 1 Shared Headwind
RTX operates three businesses that serve distinct markets. Collins Aerospace, which makes aircraft components and avionics, grew revenue organically by 5% in Q1, with commercial aftermarket up 7% and defense up 9%.
Pratt & Whitney grew revenue organically by 10%, with commercial aftermarket up 19%, driven by the GTF engine shop visit cycle. Raytheon posted 9% organic growth, with operating margins expanding by 150 basis points to 12.2%, as munitions output grew over 40% year over year.
 RTX Corporation Total Revenues, Operating Margins. (TIKR)
The revenue and margin chart shows the underlying trajectory. Revenue has grown from $64.4 billion in 2021 to $88.6 billion in 2025, while operating margins recovered from the 7.75% trough in 2023, a year that absorbed a significant one-time charge related to the GTF powder metal inspection program, to above 10% in 2024 and continuing higher in 2025.
The near-term challenge is tariffs. Management flagged an estimated $850 million operating profit headwind from tariffs that is excluded from guidance, and Collins Aerospace alone absorbed a 130-basis-point margin drag in Q1.
CEO Chris Calio addressed the demand environment on the Q1 call: “RTX delivered a very strong start to 2026 with organic sales and adjusted operating profit growth across all three segments, driven by our continued focus on execution and delivering our backlog.”
See how RTX performs against its peers in TIKR (It’s free!) >>>
What Does the Valuation Model Say?
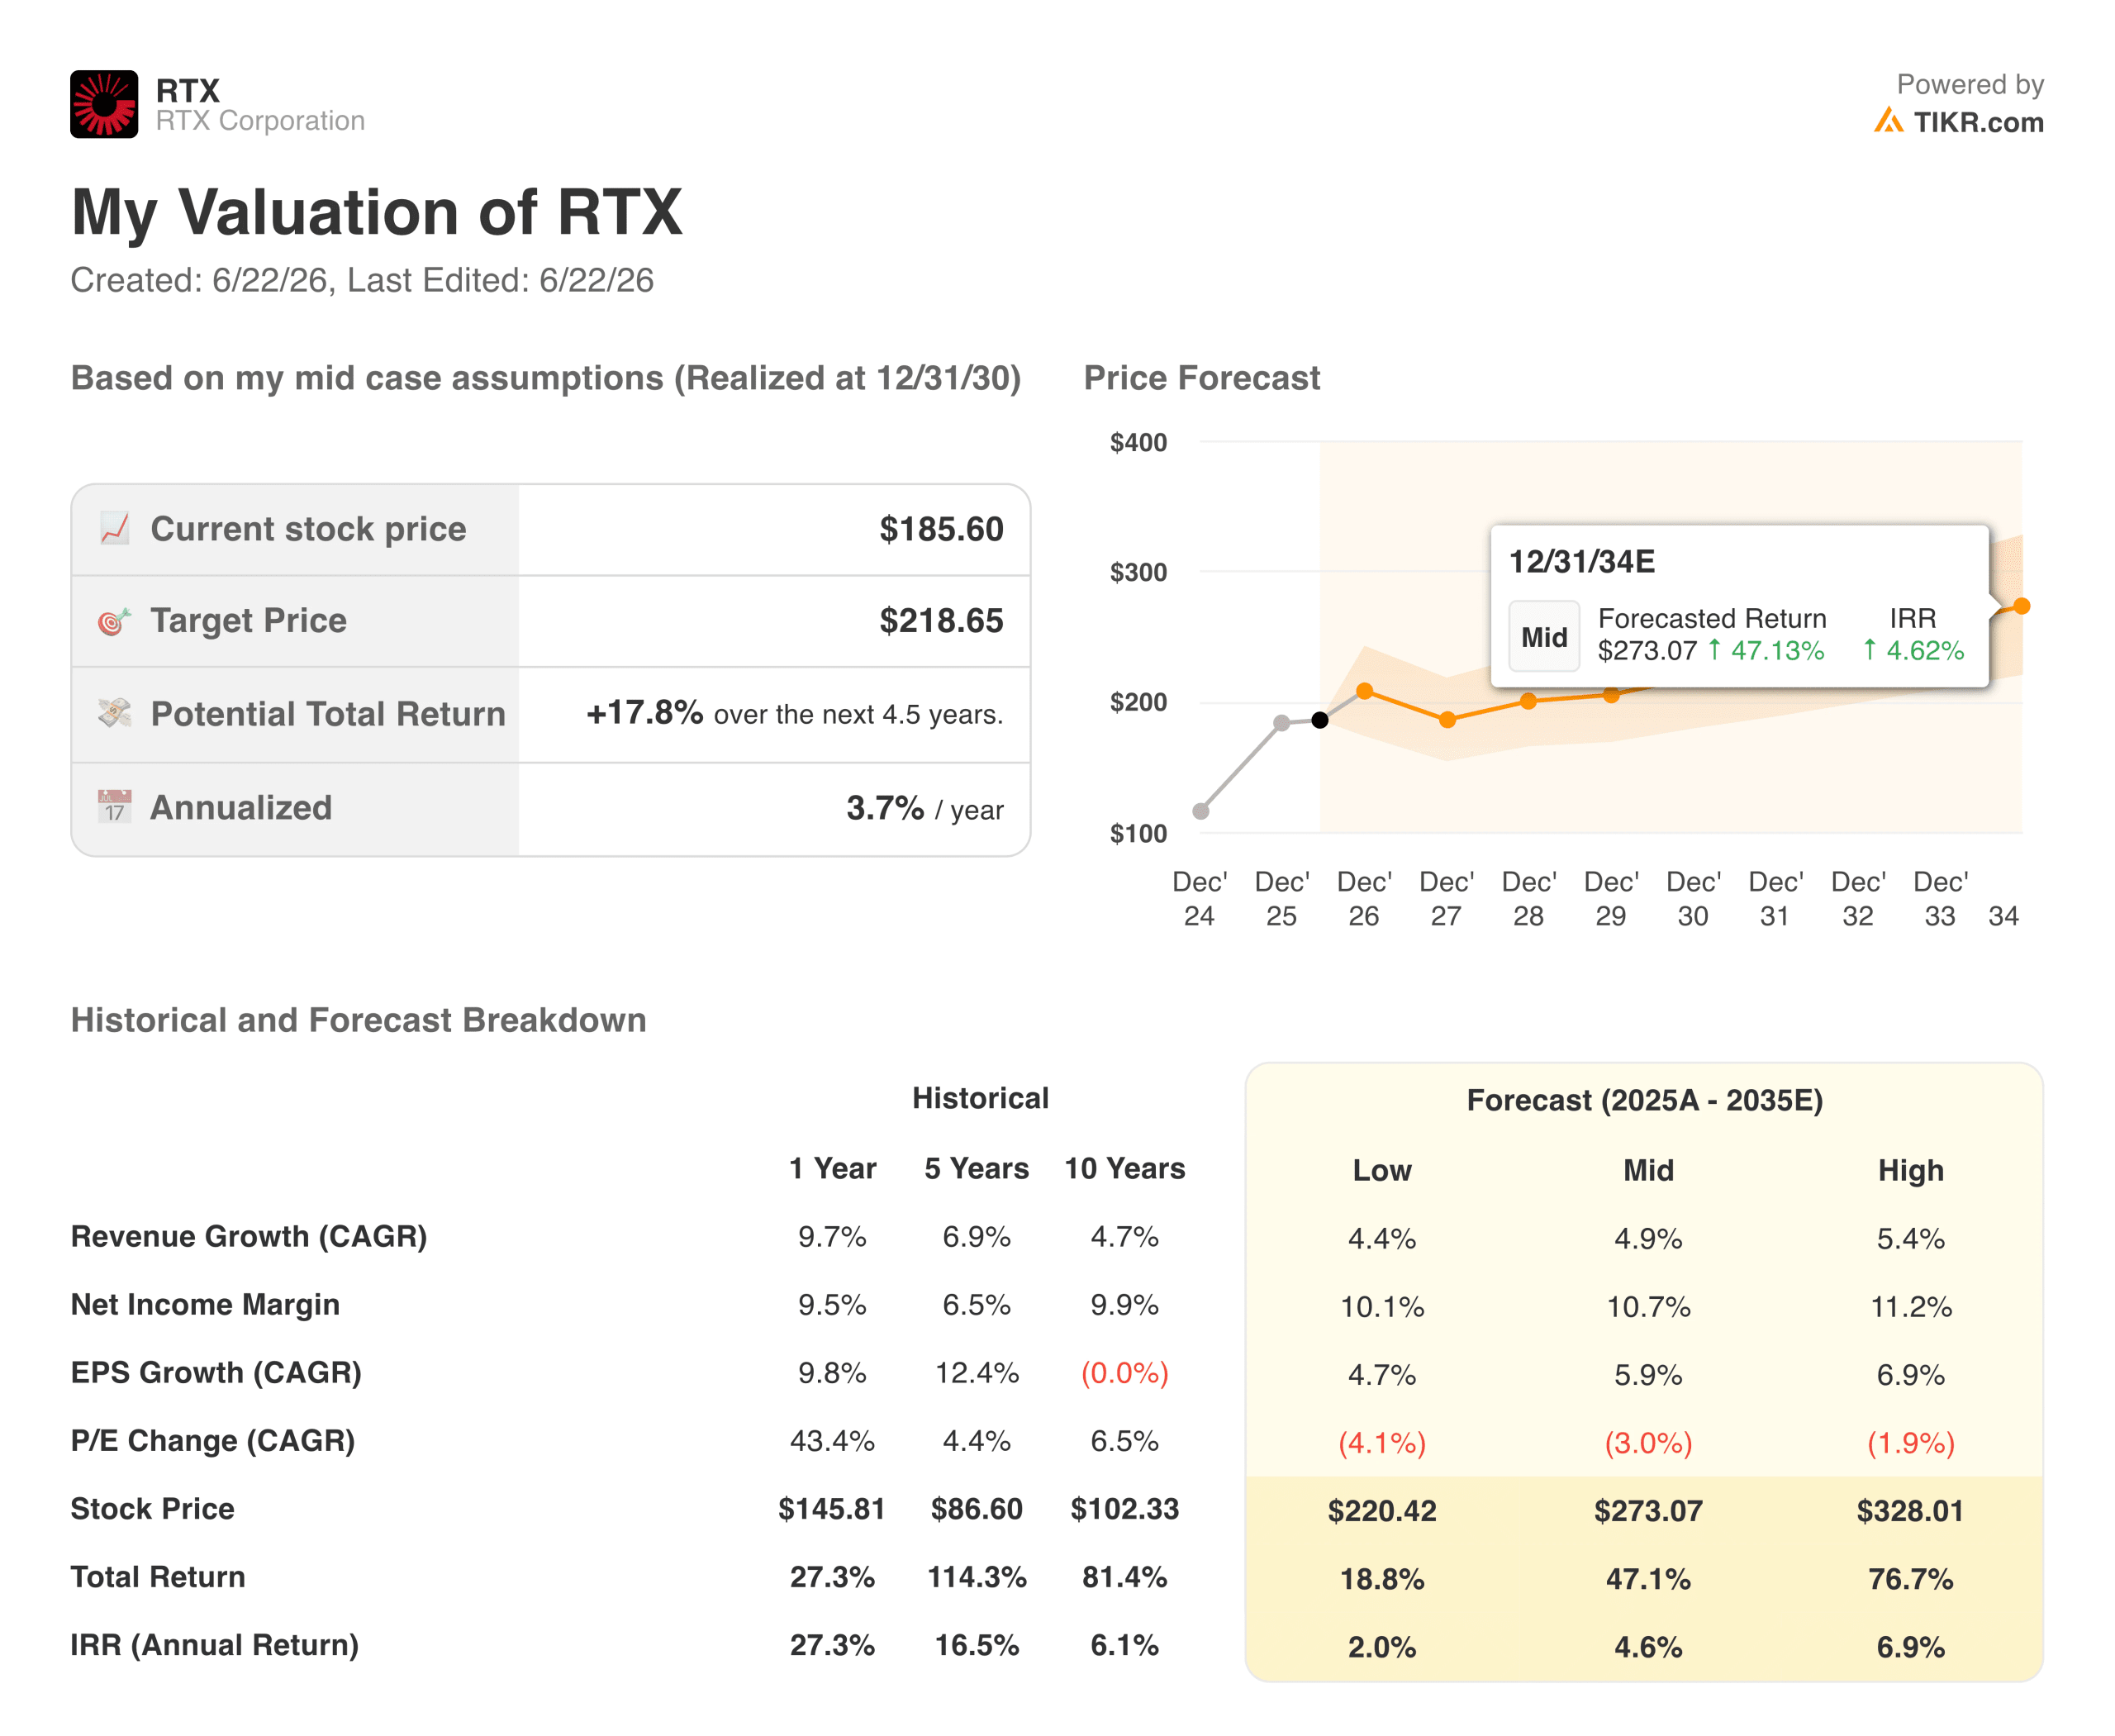
TIKR’s valuation model targets around $219 for RTX Corporation stock, with an annualized return of approximately 4% through the end of 2030, assuming mid-case revenue growth of around 5% and net income margins expanding toward 11%.
The Street mean target of around $216 is nearly identical, suggesting both frameworks are anchored to similar moderate growth assumptions.
 RTX Corporation Valuation Model. (TIKR)
The base-case return of around 4% annualized is below what most equity investors typically require, and it is worth being direct about it. The model assumes P/E multiple compression of around 3% per year as the defense sector premium normalizes over time.
The high case reaches around $328 at roughly 7% annualized, which requires faster Raytheon margin expansion, tariff resolution, and a sustained elevated defense spending cycle through the end of the decade.
Should You Invest in RTX Corporation?
RTX is not a business with demand problems. A $271 billion backlog, five landmark framework agreements covering Tomahawk, AMRAAM, and the Standard Missile family, and NATO allies expanding defense budgets at the fastest pace in decades, all point toward durable revenue growth for years.
The questions are about execution speed and whether margin recovery can arrive fast enough to make the current price worth the wait.
At roughly 4% annualized in the mid case, RTX looks more like a high-quality compounder than a near-term catalyst trade. The right question is not whether the backlog is real. It is whether the conversion timeline and margin recovery are fast enough to justify holding at $186 today.
See analysts’ growth forecasts and price targets for RTX stock (It’s free!) >>>
Looking for New Opportunities?
- See what stocks billionaire investors are buying so you can follow the smart money.
- Analyze stocks in as little as 5 minutes with TIKR’s all-in-one, easy-to-use platform.
- The more rocks you overturn… the more opportunities you’ll uncover. Search 100K+ global stocks, global top investor holdings, and more with TIKR.
Disclaimer:
Please note that the articles on TIKR are not intended to serve as investment or financial advice from TIKR or our content team, nor are they recommendations to buy or sell any stocks. We create our content based on TIKR Terminal’s investment data and analysts’ estimates. Our analysis might not include recent company news or important updates. TIKR has no position in any stocks mentioned. Thank you for reading, and happy investing!


추천 콘텐츠

Chainlink joined European and South Korean banks to explore stablecoin settlements in new cross-border project

Reading Whale Behavior Through On-Chain Supply Data

ChainAware and MelosClaw Advance AI in Web3 Growth


인기 뉴스
더보기
