USDT dominance refers to USDT’s relative share in the market and is commonly used by analysts as a sentiment and liquidity context indicator (not a standalone price predictor). Tracking USDT-relatedUSDT dominance refers to USDT’s relative share in the market and is commonly used by analysts as a sentiment and liquidity context indicator (not a standalone price predictor). Tracking USDT-related
Learn/Cryptocurrency Knowledge/Hot Concepts/Advanced Te...rket Trends

Advanced Technical Analysis: Leveraging USDT Dominance to Forecast Market Trends

Beginner
Feb 3, 2026MEXC
0m
4
4$0.009182+16.71%
Bitcoin
BTC$60,924.96-3.26%
Pendle
PENDLE$1.21-8.95%
USDT dominance refers to USDT’s relative share in the market and is commonly used by analysts as a sentiment and liquidity context indicator (not a standalone price predictor). Tracking USDT-related market share can help readers understand risk-on versus risk-off conditions and how liquidity may rotate between stablecoins and risk assets like Bitcoin and Ethereum.

Key Takeaways


  • USDT is issued on multiple blockchains (multi-chain support): See USDT networks guide (TRC20 vs ERC20 vs BEP20)
  • TRC20 USDT is commonly used for cost-efficient transfers (network fees/speed vary)
  • ERC20 USDT integrates deeply with Ethereum-based DeFi
  • Network choice mainly affects fees, speed, and compatibility. Not the token’s intended USD peg (though market price can still fluctuate slightly)
  • Common user questions often relate to compatibility and routing across networks/exchanges


1. USDT Dominance as a Market-Context Tool


USDT dominance is widely tracked in technical analysis because it can provide clues about market positioning and liquidity preference. When traders and institutions prefer holding stablecoins, it can coincide with more cautious market conditions; when the stablecoin share drops, it can coincide with greater risk appetite. This article explains how USDT dominance can be used alongside support/resistance, market structure, and multi-chain transfer behavior to interpret broader market conditions by using examples such as BTC/USDT and other USDT-quoted pairs (availability varies by platform/region).

Further reading on stablecoin comparisons:

Beyond USDT and USDC, the stablecoin landscape is also evolving with newer compliance-focused models such as USAT (USA₮), which has been introduced as a U.S.-oriented, regulated stablecoin initiative. This matters because changes in stablecoin adoption can gradually reshape how dominance-style metrics are interpreted.


2. What is USDT Dominance and Why Does it Matter?


2.1 Defining USDT Dominance


In practice, USDT dominance can be discussed in two ways:
  • USDT.D (common charting usage): USDT market cap relative to total crypto market cap
  • Stablecoin-share view (stablecoin subset): USDT market cap relative to total stablecoin market cap
Whichever definition you use, state it clearly and interpret it in context, not as a guaranteed signal. For a high-level overview of major stablecoins:

2.2 USDT Dominance as a Sentiment Indicator


Analysts often treat rising USDT-related dominance as a sign the market may be leaning risk-off (more capital parked in stablecoins), while falling dominance may align with risk-on rotation (more capital moving into BTC/ETH/altcoins). This is not a rule, but a lens that can be useful when combined with other indicators (price structure, volume, macro events, on-chain activity).

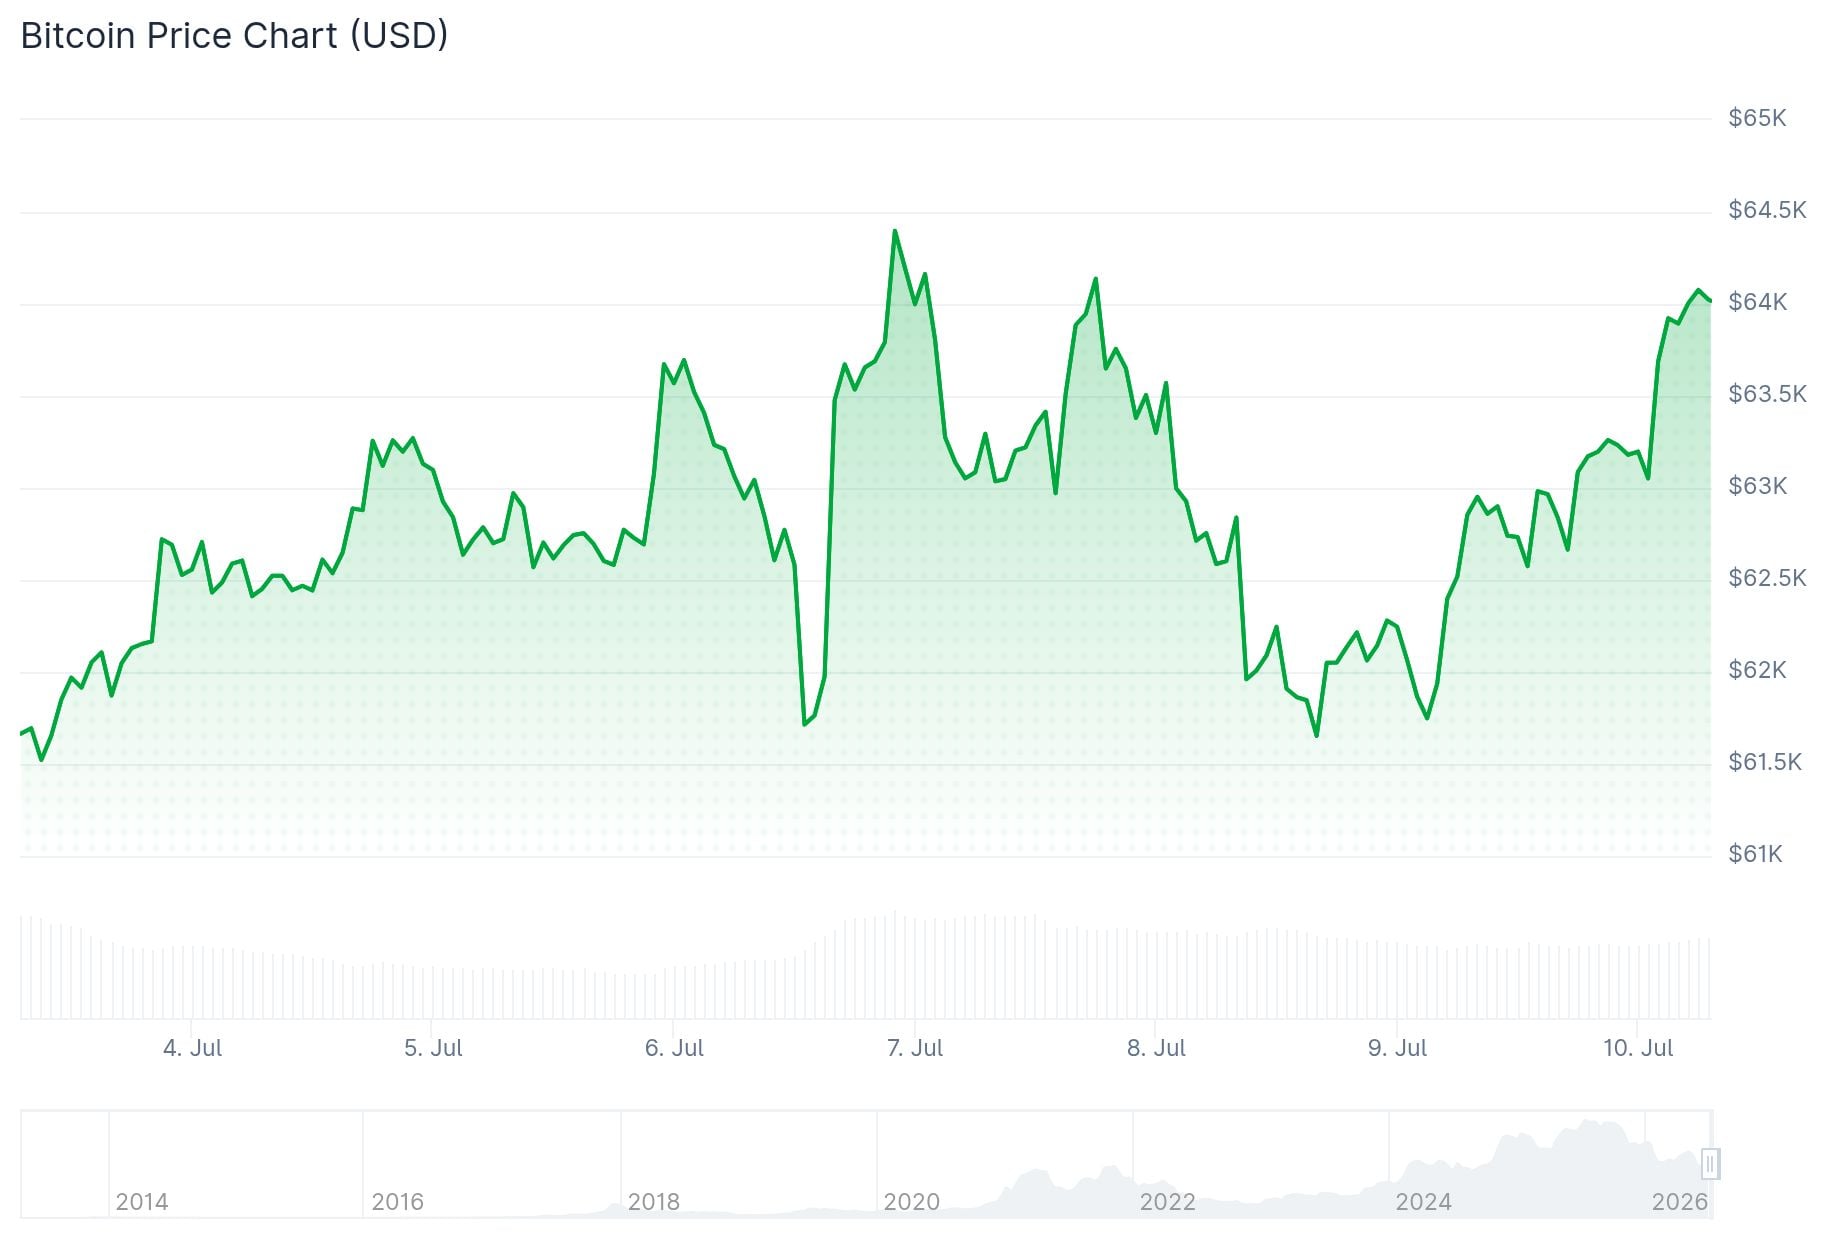
3. Using USDT Dominance to Read Bitcoin (BTC) Market Structure


3.1 BTC/USDT and Support/Resistance Levels

The BTC/USDT pair is one of the most actively traded crypto pairs. You can use classic technical tools, especially support and resistance, to interpret market structure.


Support Levels: Areas where buying interest historically appears. Resistance Levels: Areas where selling pressure historically appears.

How dominance can be used here (careful wording):
  • If stablecoin share is rising, it may coincide with more defensive positioning and tighter ranges.
  • If the stablecoin share is falling, it may coincide with more aggressive risk appetite and stronger trend attempts.

4. Extending the Lens: USDT-Quoted Altcoin Pairs (Examples)


Technical analysis isn’t limited to BTC/USDT. Many traders watch USDT-quoted pairs to understand how liquidity behaves across different tokens. These pairs can serve as micro “risk appetite” thermometers. But the signal quality varies by token, liquidity, and narrative.

4.1 Pi USDT

If you reference Pi-related liquidity/market behavior, keep it educational and avoid implying certainty. A safe way is to cite community discussion as context, not evidence:

4.2 Pendle USDT (Example: liquid pair + market structure)


If you want a more “clean” TA example, Pendle has stronger public market data tooling:


Use-case framing:

  • When broader stablecoin share falls, some risk capital may rotate into higher-beta or DeFi-related assets (not guaranteed).
  • Always validate with price structure + volume, not dominance alone.

5. Network-Specific Notes: Why TRC20 vs ERC20 Matters


USDT exists across multiple networks, and network choice affects transfer fees, speed, and wallet compatibility, a major source of user mistakes.

Core reference:

Quick framing:
  • TRC20 (Tron): often lower fees (popular for transfers)
  • ERC20 (Ethereum): higher fees (deeper DeFi integration)

6. Risk Factors and Operational Considerations


6.1 Network Compatibility Risks


Selecting the wrong network (e.g., sending TRC20 USDT to an ERC20-only address) can result in failed transfers or loss of funds. Always confirm the receiving platform’s supported network before sending.

6.2 Indicator Limitations


USDT-related dominance metrics can be influenced by multiple factors, including issuance/redemption dynamics and exchange inventory shifts. Treat it as one input rather than a decisive trigger.

7. Frequently Asked Questions


Q: What is USDT Dominance?
USDT dominance generally refers to USDT’s relative market share (either versus total crypto market cap or within the stablecoin sector). It’s commonly used as a sentiment/liquidity context metric.

Q: How does USDT dominance affect Bitcoin prices?
It doesn’t “control” price, but shifts may coincide with risk-on/risk-off behavior. Use it alongside support/resistance and market structure.


8. Conclusion


USDT dominance can be a helpful way to read market conditions, especially when combined with price structure, support/resistance, and liquidity behavior across major pairs like BTC/USDT and liquid altcoin pairs. The key is to treat it as context, not a guarantee.

Disclaimer: This information does not provide advice on investment, taxation, legal, financial, accounting, or any other related services, nor does it constitute advice to purchase, sell, or hold any assets. MEXC Learn provides information for reference purposes only and does not constitute investment advice. Please ensure you fully understand the risks involved and exercise caution when investing. The platform is not responsible for users' investment decisions.

Market Opportunity
4 Logo
4 Price(4)
$0.009182
$0.009182$0.009182
+0.72%
USD
4 (4) Live Price Chart

Popular Articles

View More
HYPE Just Reach Its All-Time High! Can It Hit $150? Hyperliquid Price Prediction Breakdown

HYPE Just Reach Its All-Time High! Can It Hit $150? Hyperliquid Price Prediction Breakdown

HYPE has gained approximately 167% year-to-date as of June 2026, making it one of the best-performing assets in the current crypto cycle. It recently set a new all-time high of $75.48 on June 2,

Is Broadcom a Buy After 12.59% Crash? Broadcom (AVGO) Stock Price Target and Analyst Consensus Explained

Is Broadcom a Buy After 12.59% Crash? Broadcom (AVGO) Stock Price Target and Analyst Consensus Explained

Broadcom beat its Q2 earnings estimates, posted 143% AI chip revenue growth, and watched its stock fall 12.59% in a single session. That kind of disconnect between fundamentals and price action is

Bitcoin ETF Outflows Explained: Why $4.4B Left Spot BTC Funds

Bitcoin ETF Outflows Explained: Why $4.4B Left Spot BTC Funds

U.S. spot Bitcoin ETFs have recorded 13 consecutive trading sessions of net outflows, with roughly $4.4 billion leaving the funds since mid-May, according to market reports citing ETF flow data. The

Bitcoin Death Cross: What It Is, What History Shows, and What Traders Watch Next

Bitcoin Death Cross: What It Is, What History Shows, and What Traders Watch Next

Key Takeaways The Bitcoin death cross forms when the 50-day moving average crosses below the 200-day moving average, signaling that short-term momentum has weakened relative to the longer-term trend.

Hot Crypto Updates

View More
Bitcoin Crashes Below $66K: $1.86B Liquidated — Perfect Storm or Buying Signal?

Bitcoin Crashes Below $66K: $1.86B Liquidated — Perfect Storm or Buying Signal?

Bitcoin crashed to $65,000–$66,000 in 24 hours, triggering over $1.86B in liquidations. Strategy's first BTC sale in 4 years, record ETF outflows, US-Iran tensions, and an AI stock rotation all

U.S. Seizes $1 Billion in Iranian Crypto — And Some May Land in Trump's Bitcoin Reserve

U.S. Seizes $1 Billion in Iranian Crypto — And Some May Land in Trump's Bitcoin Reserve

The U.S. Treasury has seized roughly $1 billion in Iranian crypto assets under Operation Economic Fury, including a $344M Tether freeze on Tron. Confiscated Bitcoin may be routed into Trump's

SpaceX Contract Crashes 45% in 30 Minutes: How Hyperliquid's Pre-IPO Bet Wiped Out $1.5M in Retail Money

SpaceX Contract Crashes 45% in 30 Minutes: How Hyperliquid's Pre-IPO Bet Wiped Out $1.5M in Retail Money

Hyperliquid's SPACEX-USDH perpetual contract crashed 45% in 30 minutes, liquidating 405 users and wiping $1.51 million. Here's the full breakdown of what went wrong and what retail traders must know.

Wall Street's Clearinghouse Picked Stellar. Here's Why It Matters.

Wall Street's Clearinghouse Picked Stellar. Here's Why It Matters.

DTCC just chose Stellar to tokenize $114 trillion in custodied securities. Here's what it means for financial infrastructure, the RWA sector, and crypto investors watching Wall Street's blockchain

Trending News

View More
STABLECOINS | Nigerian Startup, Grey, Processes Over $60 Million via Stablecoins in Just 4 Months After Product Launch

STABLECOINS | Nigerian Startup, Grey, Processes Over $60 Million via Stablecoins in Just 4 Months After Product Launch

Grey Business, the business payments platform operated by Nigerian fintech startup, Grey, processed more than $61.4 million in transaction volume in its first four

Morgan Stanley predicts SpaceX valuation hitting $3.4 trillion by 2040

Morgan Stanley predicts SpaceX valuation hitting $3.4 trillion by 2040

U.S. bank and Wall Street giant, Morgan Stanley is predicting SpaceX to hit $3.4 trillion in annual revenue by 2040, representing a 182-times increase from the

Chipotle (CMG) Stock Catches a Break as JPMorgan Calls It a Buy – Here’s Why

Chipotle (CMG) Stock Catches a Break as JPMorgan Calls It a Buy – Here’s Why

TLDR JPMorgan upgraded CMG from Neutral to Overweight after meeting with CEO Scott Boatwright and CFO Adam Rymer CMG closed at $28.18 on June 4, down ~43% since

Gold Slips Below $4,400 as Strong US Jobs Data Lifts Dollar

Gold Slips Below $4,400 as Strong US Jobs Data Lifts Dollar

BitcoinWorld Gold Slips Below $4,400 as Strong US Jobs Data Lifts Dollar Gold prices retreated below the $4,400 mark on Friday, pressured by a surging US Dollar

Related Articles

View More
Bitcoin Future: What It Is, How It Works, and Where BTC Is Headed

Bitcoin Future: What It Is, How It Works, and Where BTC Is Headed

Bitcoin sits at the center of one of finance's most debated questions: what does the Bitcoin future actually look like?The answer has two layers — the financial instrument called Bitcoin futures, and

Cathie Wood Bitcoin Price Prediction: What ARK Invest Sees by 2030

Cathie Wood Bitcoin Price Prediction: What ARK Invest Sees by 2030

Key TakeawaysCathie Wood is the founder and CEO of ARK Invest, one of the most closely followed innovation-focused investment firms in the world, with direct Bitcoin exposure through the ARK 21Shares

The Stefan Thomas IronKey: 7,002 Bitcoin, a Lost Password, and Two Attempts Left

The Stefan Thomas IronKey: 7,002 Bitcoin, a Lost Password, and Two Attempts Left

Key TakeawaysStefan Thomas received 7,002 BTC in 2011 as payment for producing an animated educational video titled "What Is Bitcoin?"He stored the private keys on an IronKey S200 — a military-grade e

What Is the Bitcoin Formula? Mining Profitability, Difficulty, and Supply Explained

What Is the Bitcoin Formula? Mining Profitability, Difficulty, and Supply Explained

Key TakeawaysThe Bitcoin formula refers to the open-source mathematical rules governing how the network issues coins, adjusts mining difficulty, and enforces its supply cap — not any trading platform.

Sign Up on MEXC
Sign Up & Receive Up to 10,000 USDT Bonus
RealStocks Now Live
RealStocks Now LiveRealStocks Now Live
Trade real U.S. stock via regulated brokerage