

Understanding Depth Charts
1. What Is a Depth Chart?
2. Basic Components of a Depth Chart
- Horizontal axis (X-axis): Shows order prices, increasing from left to right, and reflects the overall price range in the market.
- Vertical axis (Y-axis): Indicates the order quantity, i.e., the total number of buy or sell orders placed at each price level.
- Green area: Represents the buy side (bids), or the collection of orders willing to purchase at the current price or lower. A larger green area indicates stronger buying pressure.
- Red area: Represents the sell side (asks), or the collection of orders willing to sell at the current price or higher. A larger red area indicates stronger selling pressure.
- Intersection point: Marks the current market price, where buying and selling forces are balanced.
- Price range: Reflects the span of price fluctuations, indicating how much price movement the market is willing to accept.
3. How to Read a Depth Chart
3.1 Assessing Market Depth
- Dense order book with tight spreads: If buy and sell orders are layered closely together at multiple price levels, it indicates better market depth. This means many orders are concentrated near the current price, allowing traders to execute transactions closer to market value and reduce trading costs.
- Thin order book with wide gaps: Conversely, if there are large gaps between order levels, it suggests poor market depth. This indicates fewer orders at certain price levels, so traders may face wider spreads and greater price slippage when executing market orders, leading to higher trading costs.
3.2 Understanding the Balance of Buying and Selling Pressure
- Larger green area: Indicates stronger buying pressure, suggesting the market may be trending upward.
- Larger red area: Indicates stronger selling pressure, suggesting the market may be trending downward.
- Similar areas: Indicates a balance between buyers and sellers, suggesting the market may be in a consolidation phase.
3.3 Example: Interpreting a BTC Depth Chart
4. Three Key Benefits of Understanding Depth Charts
- Lower trading costs: A market with strong depth means a larger number of orders, allowing traders to buy or sell at prices closer to the actual market level, thereby reducing transaction costs.
- Avoid slippage: In markets with poor depth, there may be a large gap between the order price and the actual filled price, leading to slippage. By analyzing the depth chart, traders can anticipate market depth conditions in advance and avoid trading in conditions with high slippage risk.
- Formulate trading strategies: By combining depth chart analysis with the comparison of buying and selling pressure, traders can design more precise strategies. For example, in markets with stronger buying pressure, buying on dips may be favorable; in markets with stronger selling pressure, selling on rallies may be more appropriate.
5. Conclusion
Recommended Reading:
- Why Choose MEXC Futures? Gain deeper insight into the advantages and unique features of MEXC Futures to help you stay ahead in the market.
- MEXC Futures Trading Tutorial (App) Understand the full process of trading Futures on the app and get started with ease.
Popular Articles
View More
What Does BTC Mean in Text? We Read All 56 Slang Entries. "Because They Can" Isn't One.
Search "what does BTC mean in text" and the same answer comes back from site after site: "Because They Can." There is no record of anyone ever saying that. Two of them are the ones you'll actually

MEXC On-chain Daily Report:Russia’s State Duma will review a cryptocurrency regulation bill
Updated: July 21, 2026, 9:30 (UTC+8)|Author: MEXC Headlines Russia’s State Duma will review a cryptocurrency regulation bill. Superseed is abandoning its Layer2 and requiring users to migrate assets

MEXC Alpha Trader Research Weekly | ETF Outflows End After 8 Weeks, but a $425M Sell-Off Raises the Question: Who Is Driving BTC?
Week 2 of July 2026 Statistical Period: July 8, 2026 – July 14, 2026 Data Cutoff: July 14, 2026 Core Narrative Over the past week, the crypto market experienced a dramatic reversal, shifting from a

MEXC Alpha Trader Research Weekly | NFP Sparks a Rebound, but ETF Outflow Pressure Lingers: Can BTC Hold $63,000?
Week 1, July 2026 Reporting Period: July 1–7, 2026 Data Cutoff: July 7, 2026 Core Narrative Over the past week, the crypto market experienced a dramatic reversal, falling first before staging a
Hot Crypto Updates
View More
Bitcoin Price Eyes $65,000 as Standard Chartered Backs $100,000 Target: Is the Bottom In?
Key Takeaways Bitcoin (BTC) has rallied from about $61,400 on July 6 to an intraday high of $64,653 on July 10 and trades near $63,800 at the time of writing, as risk appetite returns across crypto.

Why Is Crypto Down Today? Bitcoin Slides Toward $62,000 as US-Iran Ceasefire Collapses
Key Takeaways Bitcoin (BTC) fell more than 2% to around $62,000 on July 8, 2026 after US President Donald Trump declared the ceasefire with Iran over at the NATO summit in Ankara. More than $450

Will Nonfarm Payroll Move Bitcoin Tonight?
Overview The U.S. June nonfarm payrolls report will be released at 8:30 a.m. ET on July 2, 2026. According to the U.S. Bureau of Labor Statistics release schedule, this report is coming on Thursday

Trending News
View More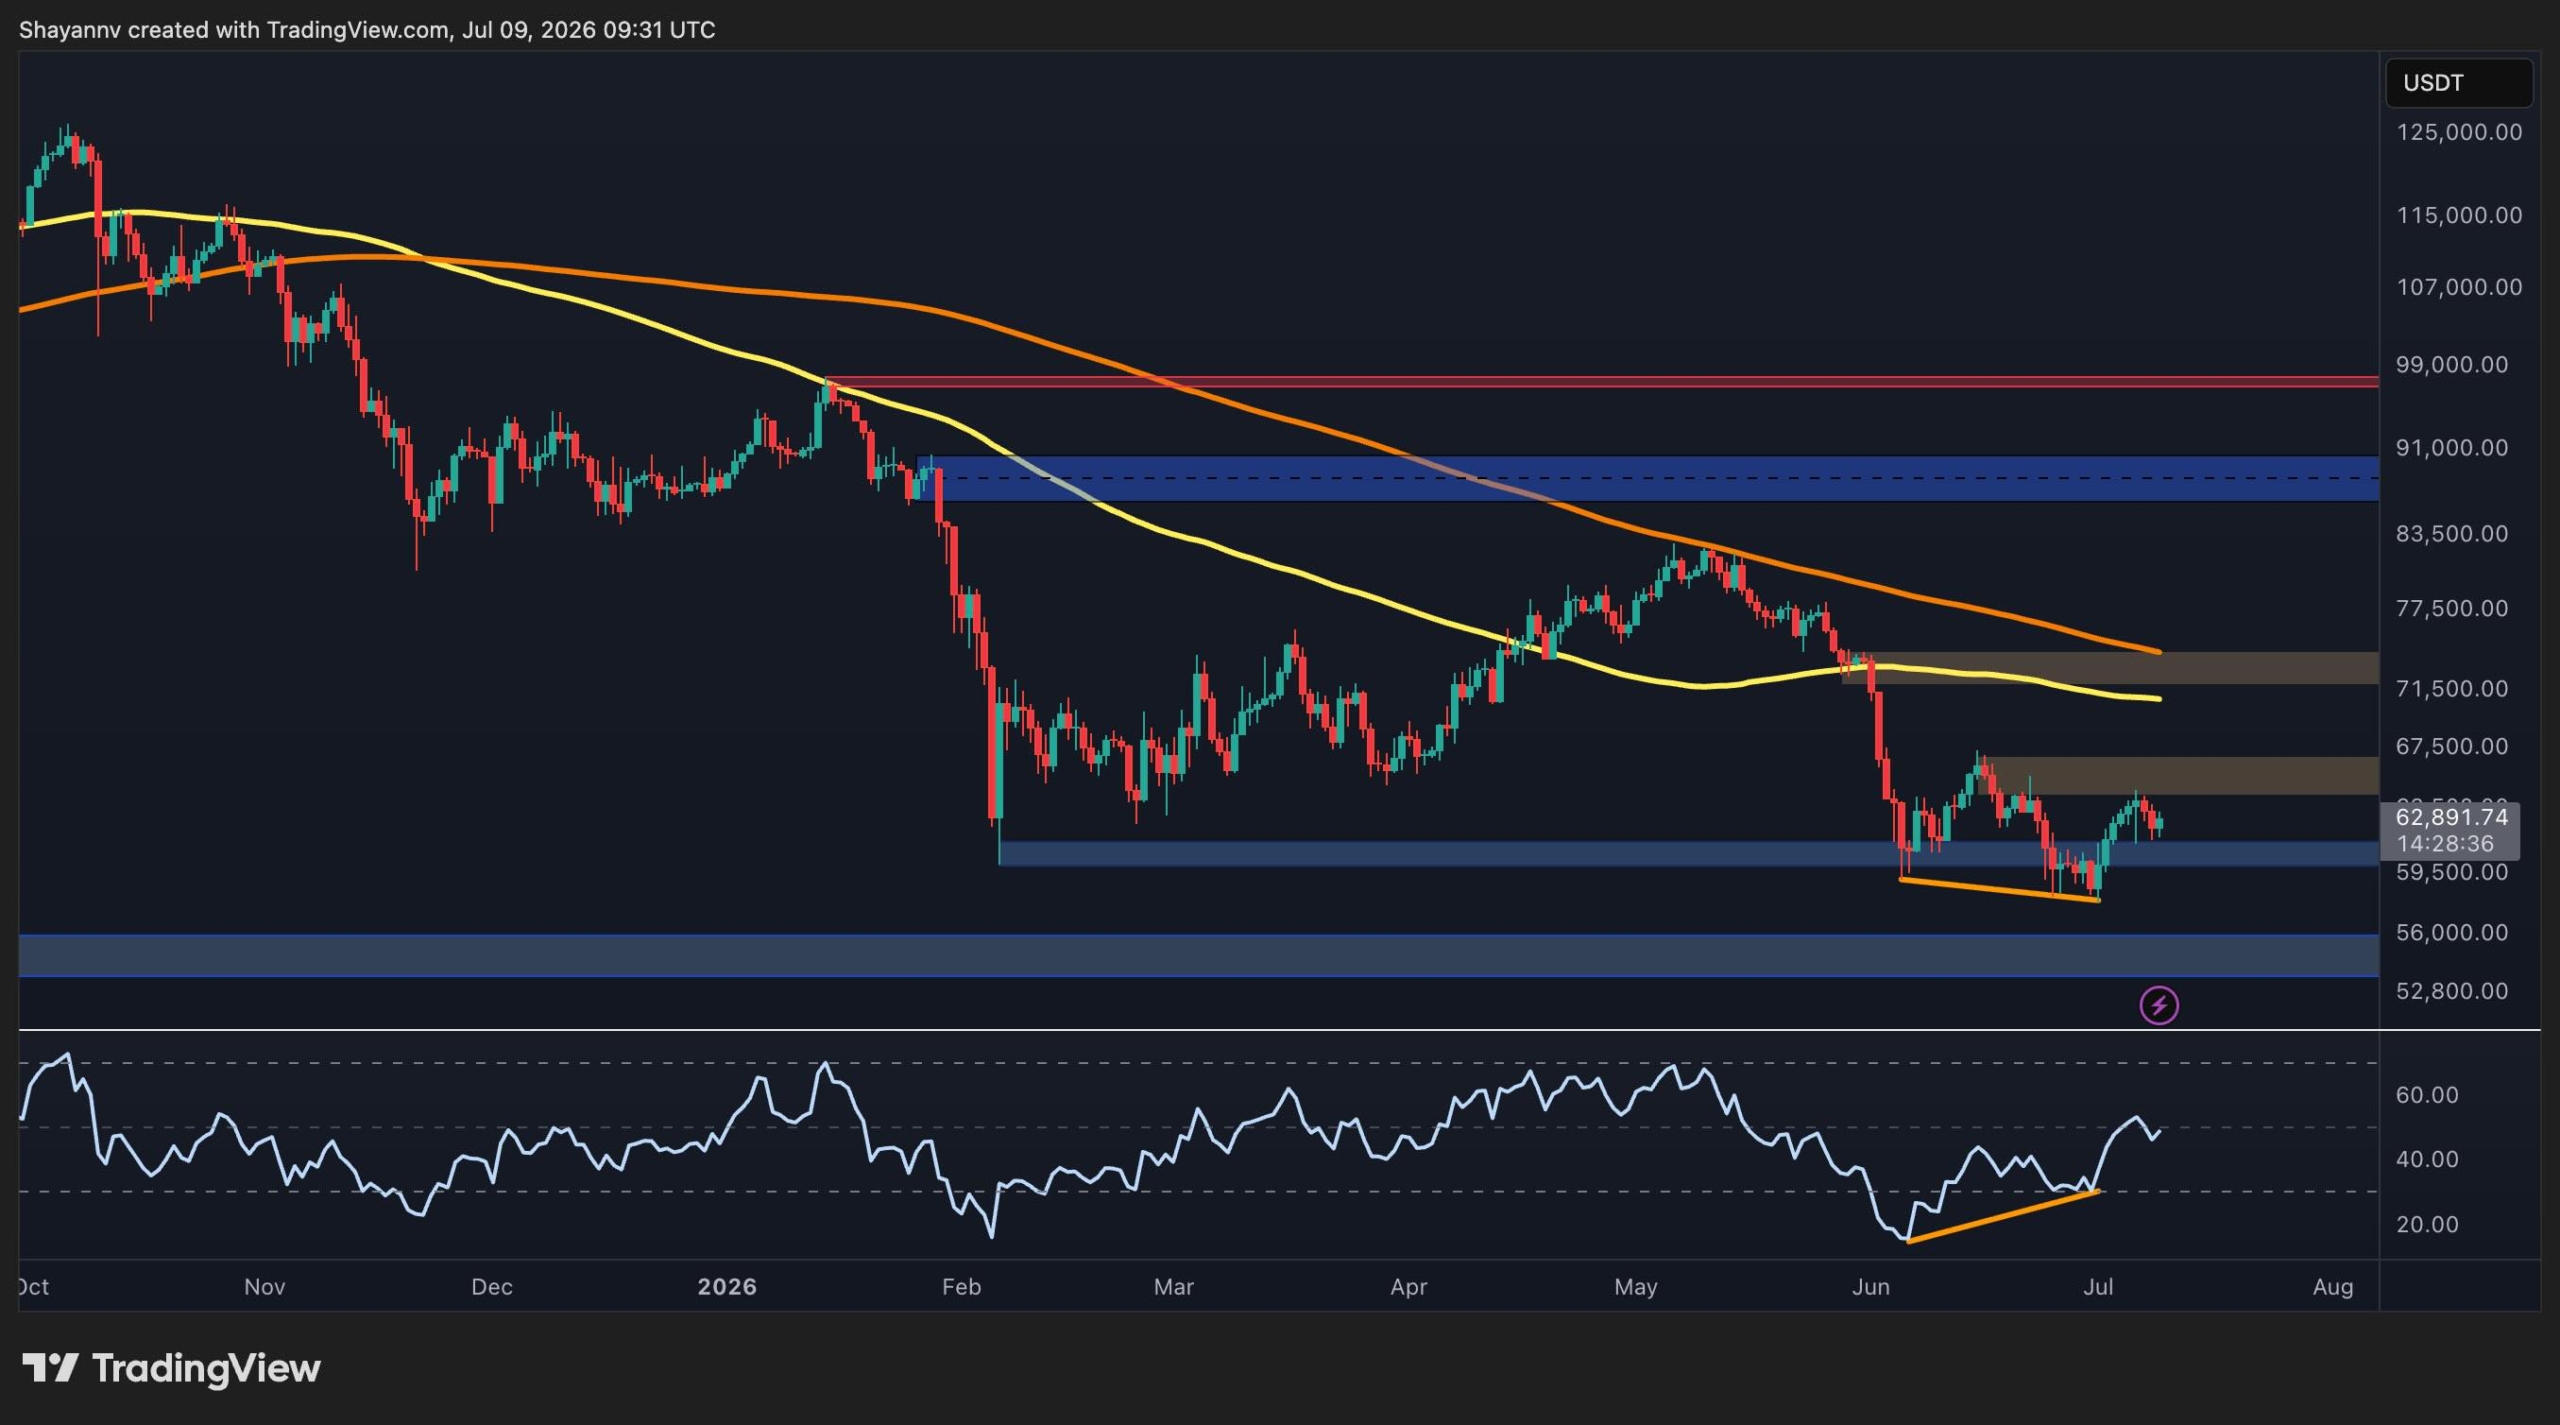
Bitcoin Price Analysis: Has BTC Cleared the Danger Zone After $64K Surge?
Despite showing signs of short-term stabilization above a major support zone, Bitcoin’s downtrend might not be over yet. While momentum has improved on lower timeframes

JPMorgan Says Bitcoin’s Bigger Risk Is Permissioned Blockchains
JPMorgan says Bitcoin's biggest long-term risk isn't Strategy selling BTC—it's the rise of permissioned blockchains that could bypass public chains and crypto


Related Articles
View More
The Complete Guide to Coin-M Perpetual Futures on MEXC
In cryptocurrency derivatives, Futures trading enables investors to apply leverage to increase potential returns and to take positions in both rising and falling markets. MEXC offers two primary types
What is MEXC Futures Earn?
1. What is MEXC Futures Earn?Futures Earn is a financial product offered by MEXC for Futures users. Once activated, eligible funds in your Futures account will automatically enroll in this exclusive E

MEXC AI Strategy for Beginners: How AI Quant Trading Works
Key Takeaways:MEXC AI Strategy is officially live, allowing users to generate futures trading strategies using natural language, making it easy for beginners to get started. It integrates social media


