

XRP (XRP) Price: Holds Above $3 Ahead of Fed Decision and ETF Launch
TLDR
- XRP currently trading above $3 as traders anticipate Federal Reserve rate decision
- Historical data suggests XRP outperforms equities during Fed rate cut cycles
- Upcoming REX-Osprey XRP ETF launch could trigger short squeeze around $3.10-$3.15 level
- XRP historically amplifies stock market gains by factor of ten during rate cut environments
- Technical analysis shows potential for XRP to test resistance at $3.20, $3.35, and all-time high of $3.66
XRP, Ripple’s native cryptocurrency, is holding steady above the important $3 mark as market participants await two key events that could drive prices higher. Traders are closely watching both the Federal Reserve’s upcoming interest rate decision and the launch of the first U.S. XRP ETF by REX-Osprey.
At press time, XRP trades around $3.02, showing resilience despite a small 0.25% decline over the past 24 hours. This price stability comes as analysts predict potential breakout scenarios based on historical patterns and current market positioning.
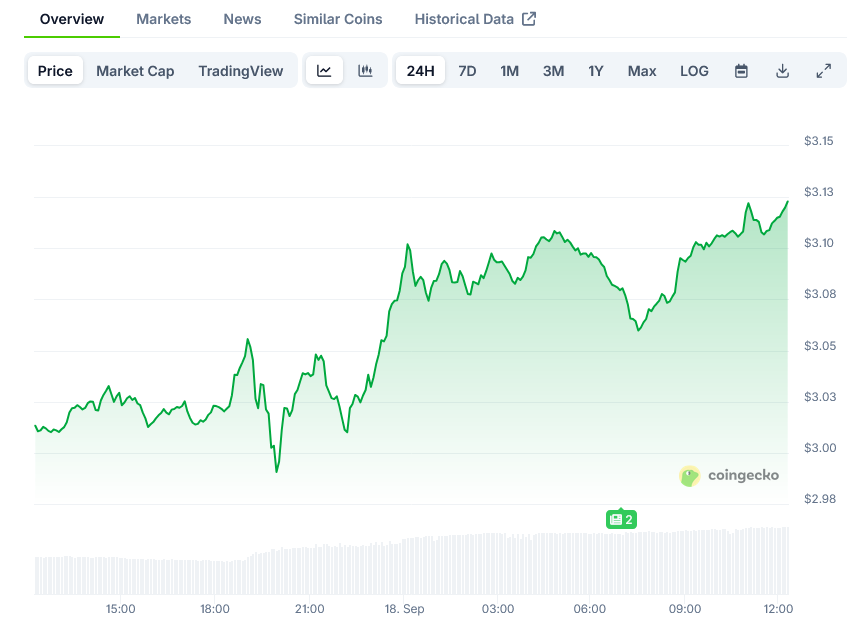 XRP Price on CoinGecko
According to data from JPMorgan, when the Federal Reserve cuts interest rates during periods when U.S. equities are near all-time highs, stocks typically deliver strong returns. On average, equities have gained approximately 15% in the 12 months following such cuts.
What makes this particularly interesting for XRP holders is the token’s historical tendency to outperform equities during these same cycles. Past data shows XRP often amplifies stock market gains by a factor of ten when rate cuts occur in strong market environments.
This correlation underscores XRP’s sensitivity to periods of increased market liquidity. As central banks ease monetary policy, speculative assets like cryptocurrencies tend to attract greater investor demand.
Fed Decision Impact
The upcoming Federal Reserve meeting represents a pivotal moment for risk assets including XRP. Market participants are debating whether policymakers will implement a 25-basis-point cut or opt for a larger 50-basis-point reduction.
A deeper cut could accelerate demand for cryptocurrencies, while a smaller adjustment might limit upward momentum. This sensitivity was demonstrated last December when XRP dropped 10% following a modest Fed rate cut paired with cautious policy guidance.
Lower interest rates generally reduce the opportunity cost of holding non-yielding assets like cryptocurrencies. This economic environment can direct capital toward higher-risk investments as investors search for returns.
The timing of this rate decision coincides with another major catalyst for XRP – the imminent launch of the REX-Osprey XRP ETF. This investment vehicle will hold XRP directly while also investing in derivatives and related assets.
ETF Launch Dynamics
The REX-Osprey XRP ETF represents a milestone for Ripple’s cryptocurrency. Pro-crypto lawyer Bill Morgan has described the fund’s approach as a “clever regulatory workaround” that provides investors exposure to XRP ahead of pending spot ETF approvals.
Market data reveals large clusters of short positions concentrated around the $3.10 to $3.15 price range. Analysts suggest that a break above these levels could trigger a wave of liquidations, forcing short sellers to exit positions and potentially fueling rapid price gains.
Such a short squeeze scenario could provide the momentum needed for XRP to test higher resistance zones at $3.20 and $3.35, before potentially challenging its all-time high of $3.66.
The potential impact of the ETF can be gauged by looking at recent precedents. Solana’s ETF attracted $230 million in capital and helped push SOL prices 70% higher in just two months. Similar inflows into the XRP ETF could provide strong support for price appreciation.
Futures market activity reflects growing anticipation, with both open interest and trading volume increasing ahead of the ETF debut. This suggests traders are positioning themselves for potential volatility.
From a technical perspective, XRP appears to be forming what some analysts describe as a rare 8-year accumulation base. A confirmed breakout above $3.35 could target $5 and beyond, potentially marking one of XRP’s most important long-term setups.
However, downside risks remain. If the ETF fails to attract investor demand or the Fed delivers a smaller-than-expected rate cut, XRP could retreat toward support levels at $2.80 or even $2.50.
Market Crossroads
The next few days represent a critical juncture for XRP. The combination of the Fed decision and ETF launch will likely determine whether the cryptocurrency can break out to new highs or faces a period of consolidation.
Longer-term price predictions suggest that sustained institutional adoption could eventually lift XRP beyond the $5 mark in coming months. This would represent a new phase in the token’s market cycle.
For now, XRP hovers at a crucial level, with bulls eyeing a breakout that could define the next leg of its price movement. The most recent data shows traders increasingly positioning for upside potential as these key catalysts approach.
The post XRP (XRP) Price: Holds Above $3 Ahead of Fed Decision and ETF Launch appeared first on Blockonomi.


You May Also Like

Q2 Market Insights: Bitcoin regains dominance in risk-averse environment, ETFs remain critical to market structure

Nebius Revenue Skyrockets 684%: Why the "Pennsylvania AI Factory" Is the New Frontier for AI Infrastructure


