

Ethereum (ETH) Price: BlackRock Invests $512M in ETF During Market Selloff
TLDR
- Ethereum dropped 15% in 24 hours, triggering over $1.5 billion in liquidations – the largest in six months
- BlackRock’s ETH ETF saw $512 million in net inflows last week despite the price decline
- ETH is now testing crucial $4,000 support level after falling from $4,636 swing high
- Federal Reserve cut rates by 25 basis points with another cut expected next month
- Technical analysis shows key resistance at $4,360 with bearish trend line formation
Ethereum has experienced a sharp decline over the past week, with the cryptocurrency dropping 15% in the last 24 hours alone. The selloff pushed ETH down to test the critical $4,000 support level.
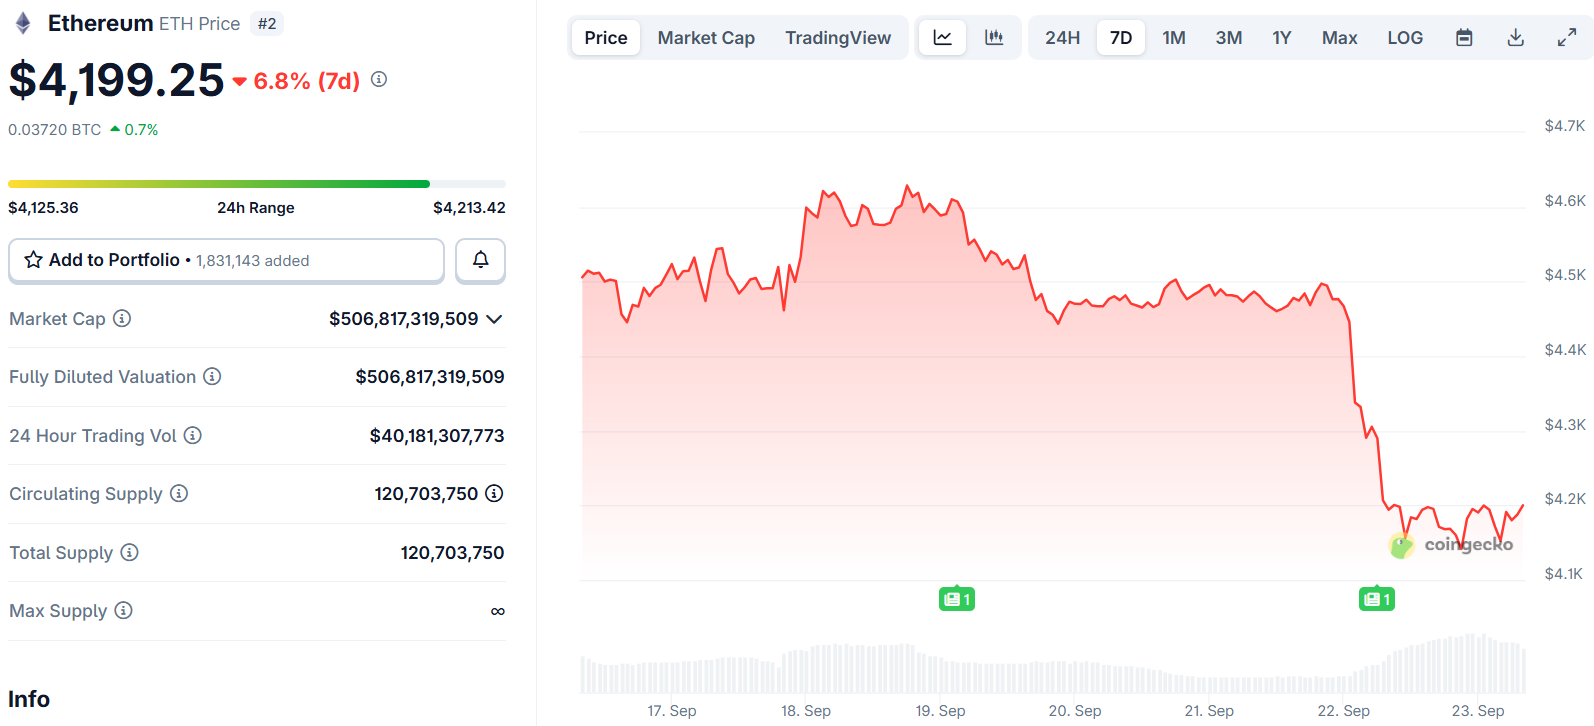 Ethereum (ETH) Price
The massive price drop triggered over $1.5 billion in liquidations. This represents the largest wave of long liquidations seen in six months for the second-largest cryptocurrency.
Despite the price weakness, institutional investors continue accumulating ETH through exchange-traded funds. Data from Farside Investors shows BlackRock’s ETH-linked fund brought in $512 million in net capital inflows last week.
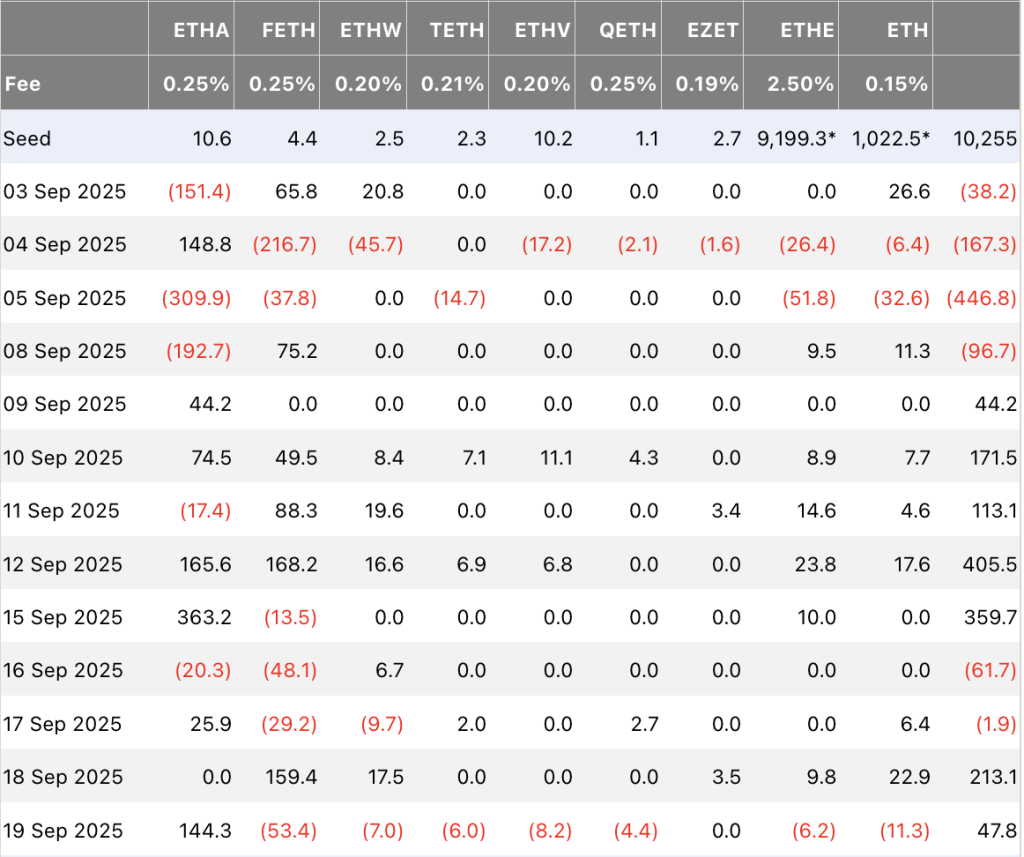 Source: Farside Investors
This buying activity occurred even as Ethereum posted a 7.6% decline over the seven-day period. The continued institutional interest suggests investors are using the price dip as a buying opportunity.
Rate Cuts Drive Risk Appetite
The Federal Reserve cut interest rates by 25 basis points last week, matching analyst expectations. Market participants are now anticipating another cut of the same magnitude for next month.
Lower interest rates typically push investors toward riskier assets like cryptocurrencies. The combined market value of altcoins has increased to more than $1.7 trillion recently.
Ethereum failed to extend gains above the $4,550 zone and started a fresh decline. The price broke below key support levels at $4,450 and $4,350.
Bears pushed the price even lower, breaking through the $4,120 support zone. A low was formed at $4,000 before the price began consolidating losses.
Technical Analysis Shows Mixed Signals
There was a minor recovery wave above the 23.6% Fibonacci retracement level. This retracement measures from the $4,636 swing high down to the $4,000 low.
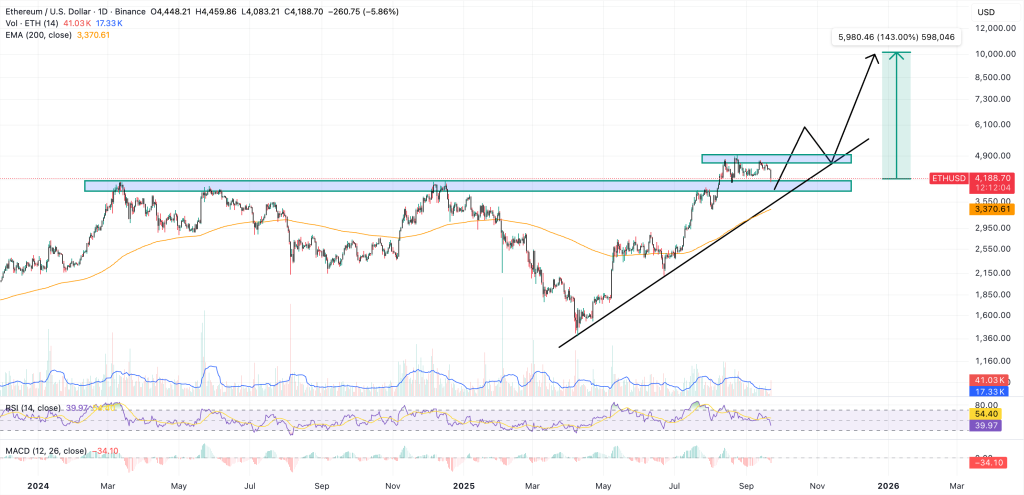 Source: TradingView
Ethereum is currently trading below $4,300 and the 100-hourly Simple Moving Average. On the upside, the price faces resistance near the $4,220 level.
The next key resistance sits near the $4,250 level. The first major resistance is near $4,320 and the 50% Fibonacci retracement level.
A bearish trend line is forming with resistance at $4,360 on the hourly chart. An upside break above this region could lead to gains toward $4,450 or $4,550.
If Ethereum fails to clear the $4,220 resistance, another decline could begin. Initial support on the downside sits near the $4,120 level.
The first major support is located near the $4,050 zone. A clear move below this level might push the price toward the $4,000 support again.
Any further losses could send the price toward the $3,880 region. The next key support after that sits at $3,750.
Technical indicators show mixed signals for the near term. The hourly MACD is gaining momentum in the bearish zone while the RSI has moved below the 50 level.
ETH is now hovering near its lowest price in two months as the consolidation continues around current levels.
The post Ethereum (ETH) Price: BlackRock Invests $512M in ETF During Market Selloff appeared first on CoinCentral.
You May Also Like

Microsoft Corp. $MSFT blue box area offers a buying opportunity

Marathon Digital BTC Transfers Highlight Miner Stress
