The crypto market faced a brutal selloff today, with over $1 billion in leveraged long positions liquidated in just an hour. Bitcoin and Ethereum led the plunge, triggering panic across exchanges. Excessive leverage and margin calls amplified the crash, while technical indicators like RSI and trading volume signaled deep market stress. Though some analysts see potential short-term rebounds, volatility remains high, reminding traders that crypto’s rewards come with equally steep risks.The crypto market faced a brutal selloff today, with over $1 billion in leveraged long positions liquidated in just an hour. Bitcoin and Ethereum led the plunge, triggering panic across exchanges. Excessive leverage and margin calls amplified the crash, while technical indicators like RSI and trading volume signaled deep market stress. Though some analysts see potential short-term rebounds, volatility remains high, reminding traders that crypto’s rewards come with equally steep risks.

Over $1 Billion Vanishes: Crypto Market Hit by Sudden Liquidation Wave

3 min read
crypto
  • Over $1 billion in leveraged long positions were wiped out in just one hour, causing significant market disruption.
  • Bitcoin and Ethereum led the crash, with long traders absorbing more than 95% of liquidations.
  • High volatility and margin calls underscore that while crypto offers big rewards, the risks remain equally steep.

The cryptocurrency market took a brutal hit today, with over $1 billion in leveraged long positions wiped out in just one hour. Bitcoin and Ethereum led the plunge, sparking panic across exchanges. The liquidation chart tells the story: steady activity through the day, then a towering green spike marking the $1 billion flush. Bitcoin’s sharp drop is shown by the yellow line, showing how forced selling triggered the crash.
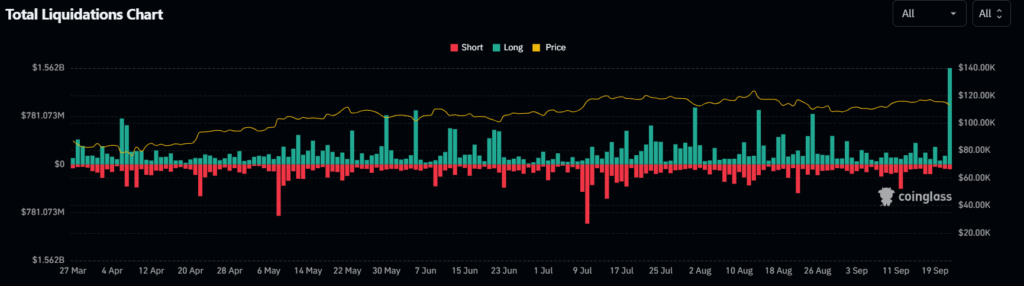
Source: Coinglass

$1B Flash Wipeout Sends Crypto Market Reeling

Unlike previous selloffs driven by hacks or whale moves, this wipeout was fueled by macro pressures and leverage mismanagement. This raises interest rates & inflation fears, safer assets like bonds and treasuries suddenly look more attractive, pulling money out of riskier bets like crypto.

Too much leverage caused a chain reaction of margin calls, which led to more liquidations and sped up Bitcoin’s drop. Bitcoin’s price plunged sharply to around $112,000, with high trading volume and momentum indicators signalling strong bearish pressure.
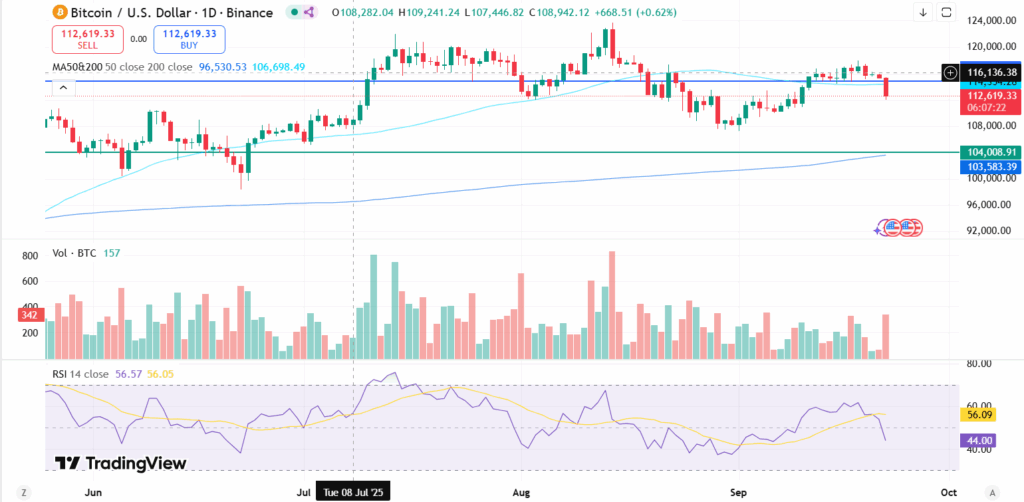
Source: TradingView

According to data from TradingView, Bitcoin’s chart tells the story in real time. As prices plunged toward $112,000, a massive red candle sliced through the 50-day moving average. It is clear evidence of panic selling. Volume surged as liquidations kicked in, and momentum indicators like RSI dropped sharply, reflecting not just technical weakness but shaken confidence across the market.

ETH and BTC Lead Long Liquidations

Today’s meltdown echoes previous flash crashes. In February 2025, over $2.2 billion in long positions were liquidated within a single day after the Trump administration’s surprise tariffs rocked global markets. Looking back to previous performances, long traders tend to absorb the heaviest losses. The aggressive leverage leaves them vulnerable to even small pullbacks.

According to data curated by Coinglass, this time was no different; more than 95% of liquidations came from longs. Long traders bore the brunt of today’s Wipeout, with ETH and BTC leading losses.

Source: Coinglass

Also Read: Inside Today’s Crypto Market: What Went Down in the Crypto Market?

Crypto Market Insight: High Risks, Uncertain Moves

Market sentiment is still on shaky ground. With central banks hinting at tighter policies ahead, traders are treading carefully, unsure of what’s next. Volatility isn’t going anywhere. For now, this crash serves as a stark reminder: crypto may offer big rewards, but it comes with equally big risks..

According to a recent post on X by MerlijnTrader, Bitcoin appears to be retracing the infamous 2017 crash. It is not just in charts, but in sentiment too. After reaching highs, the market went through a period of hesitation and panic, and now seems to be hitting a low point. With $1 billion wiped out in just an hour, it seems like history’s “final flush” is playing out again. Whether the past truly repeats or simply rhymes, the fear is tangible, and so are the losses.

Today’s $1 billion wipeout shows just how fast the crypto market can turn. Bitcoin and Ethereum led the losses, proving that leverage can amplify panic in minutes. The market’s emotional swings echo past crashes like 2017, reminding traders that while crypto can offer big rewards, it carries equally big risks. Managing risk remains more important than chasing gains.

Also Read: XRP, BNB, & Dogecoin Dominate as Explosive Trending Coins While Crypto Market Heats Up

Market Opportunity
DeepBook Logo
DeepBook Price(DEEP)
$0.02419
$0.02419$0.02419
-6.00%
USD
DeepBook (DEEP) Live Price Chart
Disclaimer: The articles reposted on this site are sourced from public platforms and are provided for informational purposes only. They do not necessarily reflect the views of MEXC. All rights remain with the original authors. If you believe any content infringes on third-party rights, please contact service@support.mexc.com for removal. MEXC makes no guarantees regarding the accuracy, completeness, or timeliness of the content and is not responsible for any actions taken based on the information provided. The content does not constitute financial, legal, or other professional advice, nor should it be considered a recommendation or endorsement by MEXC.

You May Also Like

Microsoft Corp. $MSFT blue box area offers a buying opportunity

Microsoft Corp. $MSFT blue box area offers a buying opportunity

The post Microsoft Corp. $MSFT blue box area offers a buying opportunity appeared on BitcoinEthereumNews.com. In today’s article, we’ll examine the recent performance of Microsoft Corp. ($MSFT) through the lens of Elliott Wave Theory. We’ll review how the rally from the April 07, 2025 low unfolded as a 5-wave impulse followed by a 3-swing correction (ABC) and discuss our forecast for the next move. Let’s dive into the structure and expectations for this stock. Five wave impulse structure + ABC + WXY correction $MSFT 8H Elliott Wave chart 9.04.2025 In the 8-hour Elliott Wave count from Sep 04, 2025, we saw that $MSFT completed a 5-wave impulsive cycle at red III. As expected, this initial wave prompted a pullback. We anticipated this pullback to unfold in 3 swings and find buyers in the equal legs area between $497.02 and $471.06 This setup aligns with a typical Elliott Wave correction pattern (ABC), in which the market pauses briefly before resuming its primary trend. $MSFT 8H Elliott Wave chart 7.14.2025 The update, 10 days later, shows the stock finding support from the equal legs area as predicted allowing traders to get risk free. The stock is expected to bounce towards 525 – 532 before deciding if the bounce is a connector or the next leg higher. A break into new ATHs will confirm the latter and can see it trade higher towards 570 – 593 area. Until then, traders should get risk free and protect their capital in case of a WXY double correction. Conclusion In conclusion, our Elliott Wave analysis of Microsoft Corp. ($MSFT) suggested that it remains supported against April 07, 2025 lows and bounce from the blue box area. In the meantime, keep an eye out for any corrective pullbacks that may offer entry opportunities. By applying Elliott Wave Theory, traders can better anticipate the structure of upcoming moves and enhance risk management in volatile markets. Source: https://www.fxstreet.com/news/microsoft-corp-msft-blue-box-area-offers-a-buying-opportunity-202509171323
Share
BitcoinEthereumNews2025/09/18 03:50
Marathon Digital BTC Transfers Highlight Miner Stress

Marathon Digital BTC Transfers Highlight Miner Stress

The post Marathon Digital BTC Transfers Highlight Miner Stress appeared on BitcoinEthereumNews.com. In a tense week for crypto markets, marathon digital has drawn
Share
BitcoinEthereumNews2026/02/06 15:16
Fintech in a Fragmented World: Building Financial Products Across Geopolitical Lines

Fintech in a Fragmented World: Building Financial Products Across Geopolitical Lines

For most of the last ten years, the fintech growth story was one without borders. Startups made digital wallets, payment platforms, lending systems, and trading
Share
Globalfintechseries2026/02/06 15:17