

SUI Eyes Major Breakout as Deep Fib Pullback Meets Macro Trend Support Zone

SUI trades near $0.92 as deep Fib support, a macro trendline, and $1.4434 resistance guide its next breakout test.
SUI is gaining traction as its daily chart shows a deep Fibonacci pullback near a wider trend support area.
The token trades near $0.9256 against USDT on Binance, while traders track the $0.50 support level and the $1.4434 resistance zone for the next major move.
SUI Tests Deep Fibonacci Support Zone
SUI has pulled back into the 0.786 Fibonacci retracement area, based on the chart structure shared by analysts.
This zone often attracts attention because it sits near the end of a deep correction.
The level also appears close to a macro ascending trendline. That creates a technical confluence area for traders watching long-term support.
However, price still needs confirmation before a trend change can be reported.
SUI is currently trading near $0.9220. The token remains below the prior support level at $1.4434. This level now acts as the main resistance on the daily chart.
A daily close above $1.4434 would improve the recovery setup. Until then, the broader chart still shows weak structure. Sellers remain active below that level.
2024 Accumulation Pattern Draws Market Focus
Some traders have compared the current structure with SUI’s 2024 accumulation phase. That earlier base came before a sharp rally of more than 1,000%.
The comparison has added interest to the current support area. The setup does not confirm a repeat of that move.
It only shows that traders are watching similar market behavior. Deep pullbacks can form bases, but they can also extend lower.
The main bullish case depends on SUI holding above $0.50. Analysts have described that level as the key validation area.
A weekly close below $0.50 would weaken the larger recovery setup. Targets discussed by traders include $1.80, $4.00, $10, and $20.
These levels remain technical targets, not guaranteed price outcomes. Each level would require stronger demand and higher market volume.
Read Also: Sui DeFi Hit Again as $1.14M Is Drained in Perp Exploit
SUI Resistance And Momentum Levels To Watch
The first short-term resistance sits near $1.00. A move above that level could support a push toward $1.20.
The larger test would still come near $1.4434. If SUI clears $1.4434, the next Fibonacci levels appear near $1.8211 and $2.1175.
Further resistance is seen near $2.3257 and $2.5339. These zones may attract selling if volume remains low.
The strongest overhead region remains between $2.79 and $3.20. This area matches the prior breakdown zone. It also aligns with upper Fibonacci resistance shown on the chart.
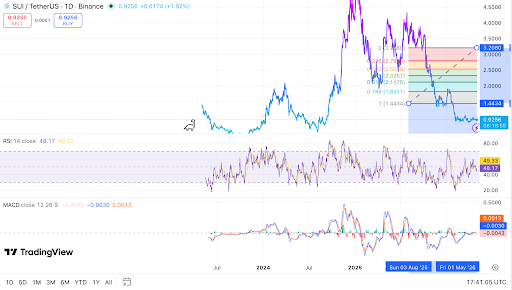 SUI/USDT daily chart shows Fibonacci levels and support zones, source: TradingView.
The RSI is near 47 on the daily chart. This places it below the neutral 50 level. It suggests that buying pressure has improved, but not enough to confirm strength.
The MACD is also close to the zero line. Its histogram remains nearly flat. This points to weak momentum and a possible consolidation phase.
For now, SUI eyes a major breakout as a deep Fibonacci pullback meets macro trend support. The key levels remain $0.50 for invalidation, and $1.4434 for recovery confirmation.
The post SUI Eyes Major Breakout as Deep Fib Pullback Meets Macro Trend Support Zone appeared first on Live Bitcoin News.


You May Also Like

Dow Jones futures plunge as risk aversion increases after Trump’s comments

REGULATION | Brazil Prohibits Use of Crypto in Regulated Cross-Border FX Payment Settlements


