

XRP Price: The Chart Pattern That Last Sparked a 66% Rally Is Back
TLDR
- XRP is repeating a 2025 chart pattern that previously triggered 66% gains to $3.66
- The bull flag breakout above $1.40 is the key level analysts are watching
- A symmetrical triangle on the daily chart points to a possible move toward $1.90, then $2
- Spot taker CVD flipped positive on May 1, showing buyers are back in control
- Open interest delta hit +$27 million on May 1, reflecting fresh derivatives positioning
XRP is trading near $1.39–$1.41 as of early May 2026, consolidating after testing short-term highs. The price action is drawing attention from analysts who see similarities to a chart structure that played out in mid-2025.
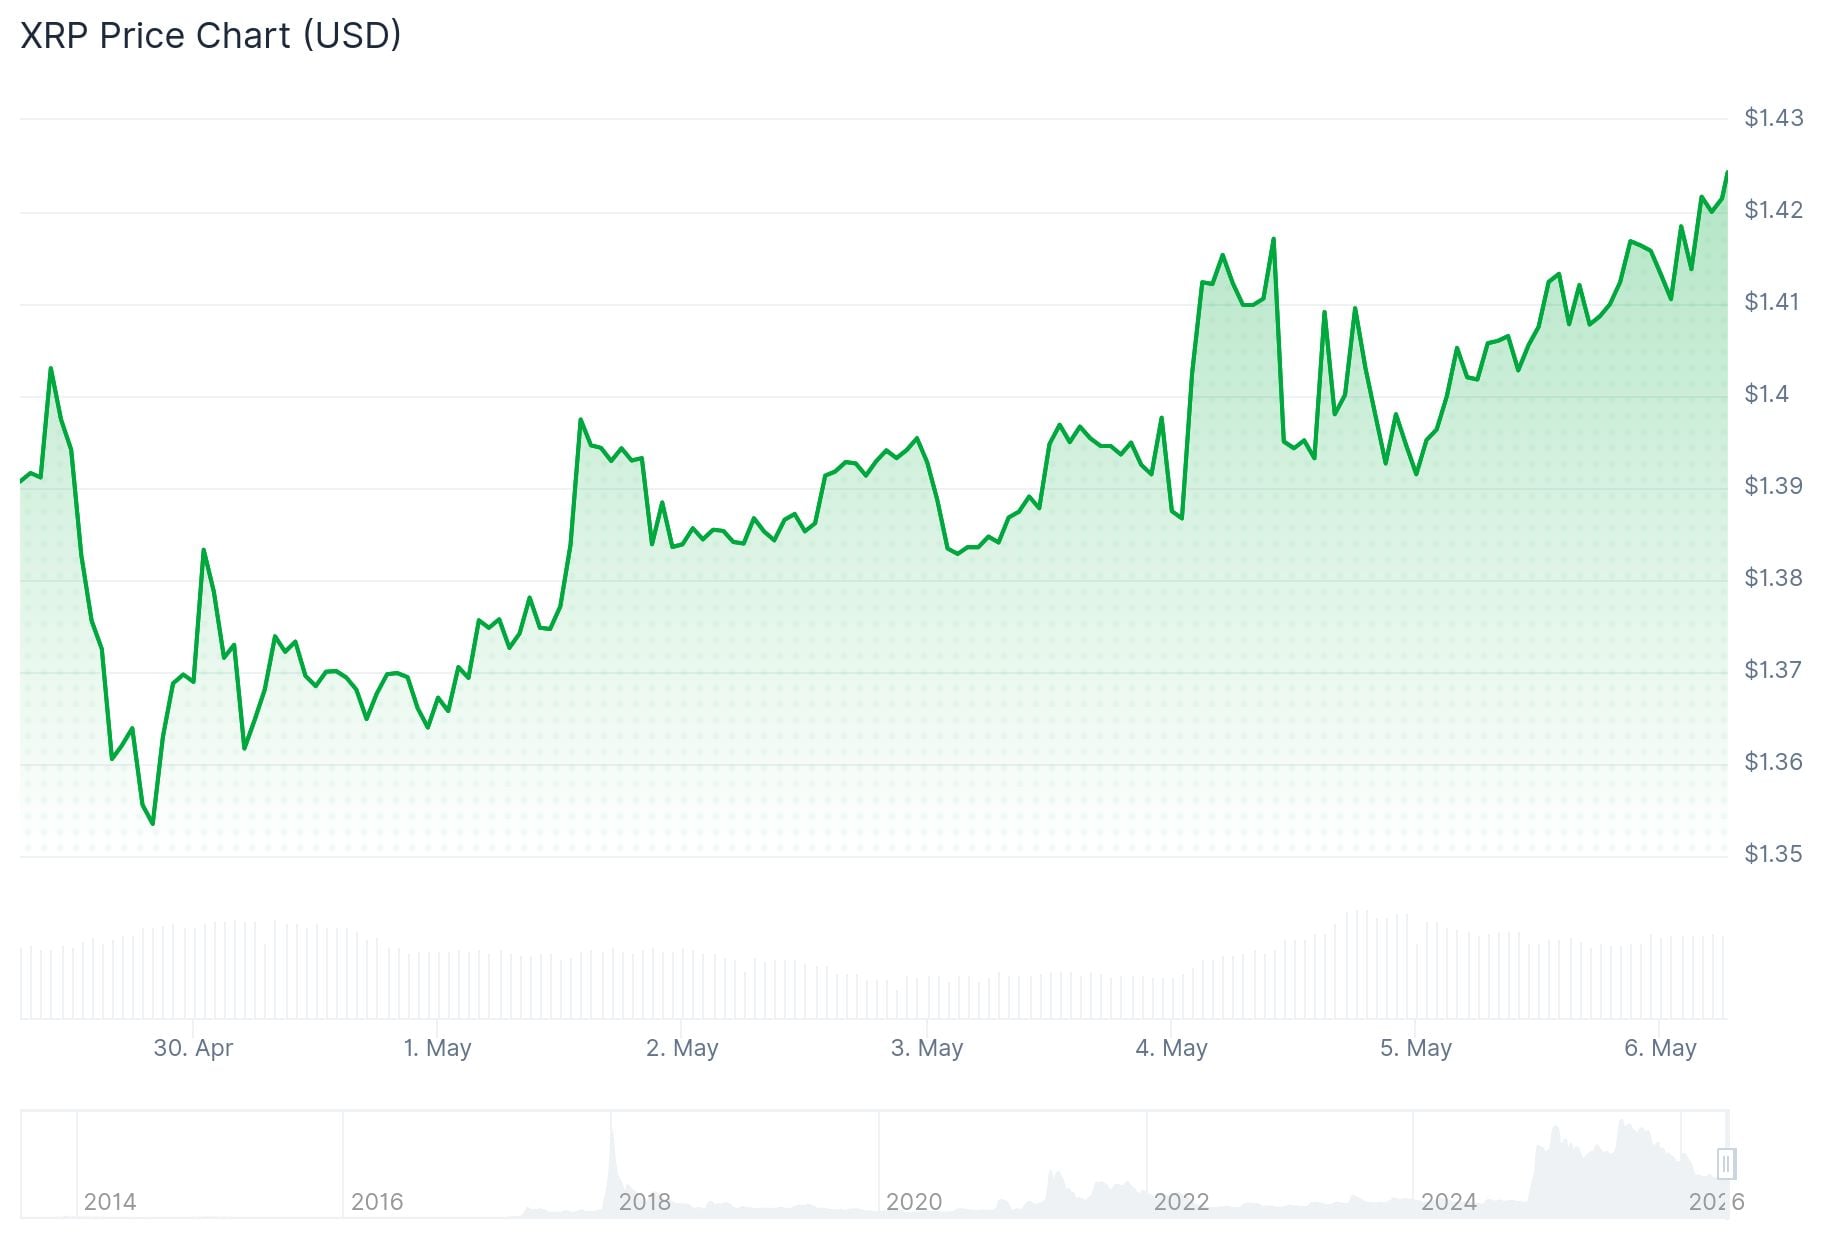 XRP Price
That 2025 pattern — a bull flag followed by a bullish EMA crossover — led to a 66% rally in under two weeks, pushing XRP from around $2.21 to its current all-time high of $3.66.
Today’s setup is following the same script. XRP has broken out of a similar bull flag, and the 20-day and 50-day EMAs are nearing a bullish crossover.
If the 66% fractal repeats from current levels, a price target of around $2.35 comes into view.
Buyers Return as CVD Flips Green
One of the cleaner data points backing the bullish case is XRP’s 90-day spot taker cumulative volume delta (CVD). This metric measures the difference between buy and sell volume over three months.
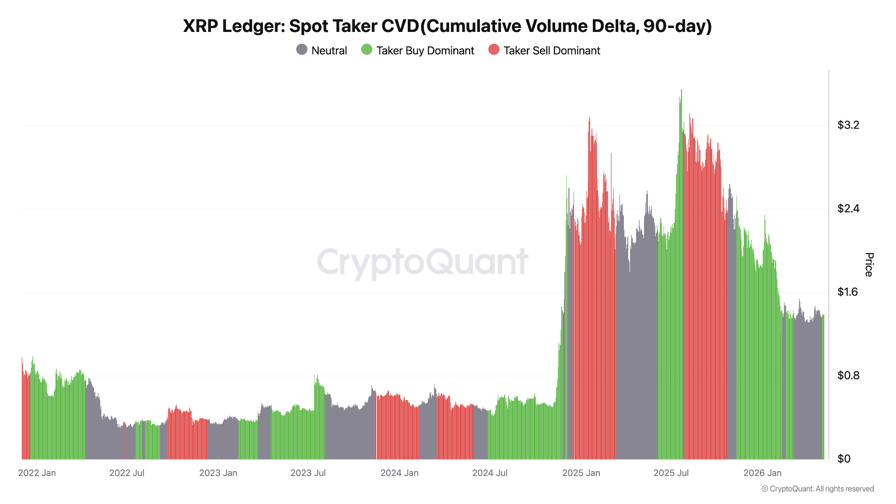 Source: CryptoQuant
It flipped positive on May 1, the same day XRP broke above the $1.38 resistance level. A similar CVD flip happened in June 2025 and preceded 70% gains.
CryptoQuant analyst Amr Taha highlighted a sharp positive reading in open interest delta, which hit $27 million on May 1. “When this happens while price is rising, it often shows that traders are increasing exposure as momentum begins to recover,” Taha said.
Triangle Pattern Points to $1.90
On the daily chart, a separate symmetrical triangle pattern is also forming. In this structure, two converging trendlines compress price until a breakout occurs.
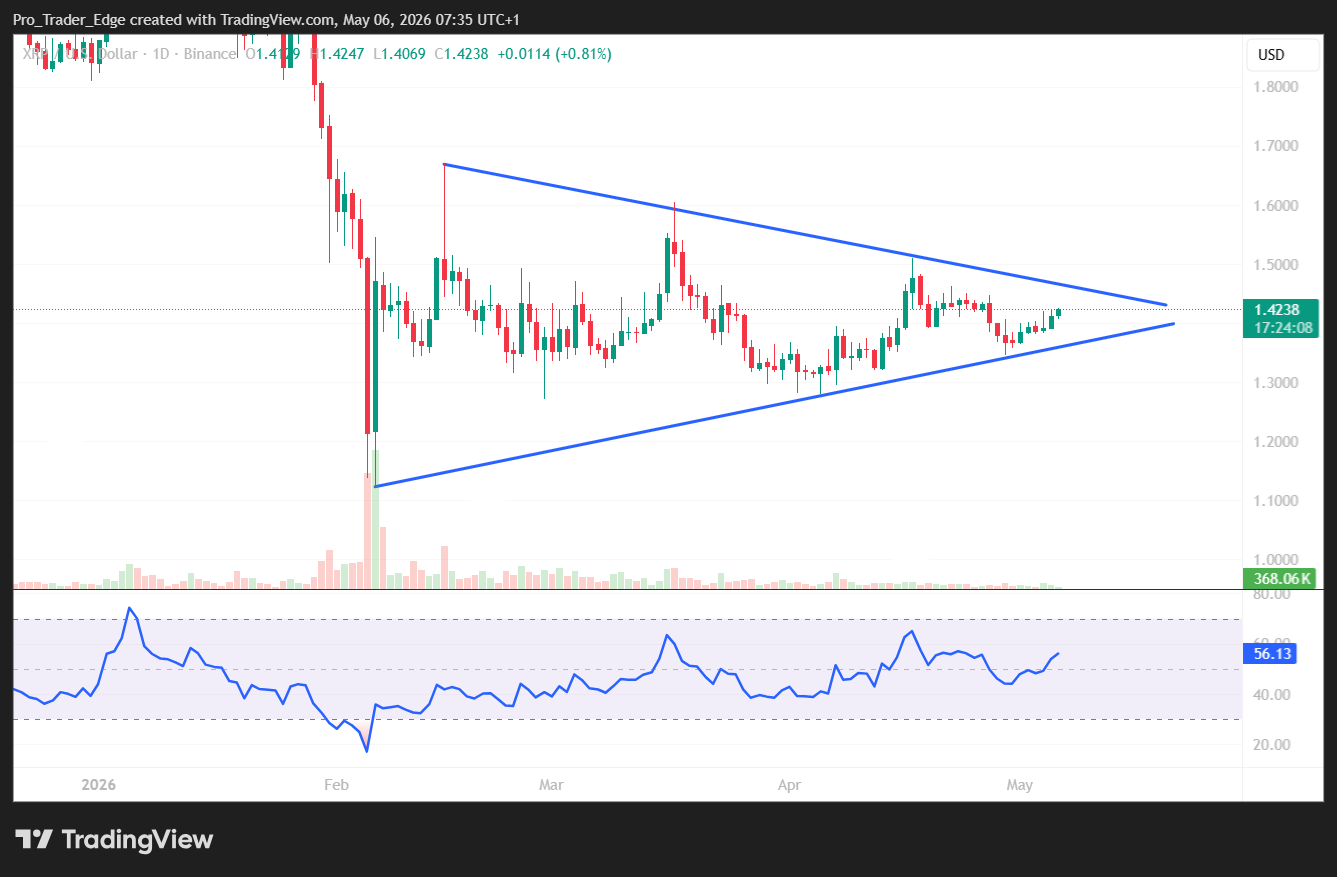 Source: TradingView
A confirmed move above $1.45 would validate this pattern and project a target near $1.90 — a level derived from the triangle’s height. Beyond that, the $2 level is the next psychological target.
Momentum indicators are lining up too. The Supertrend indicator has flipped green, signaling a trend shift. The MACD is nearing a bullish crossover, which, if confirmed, would add further weight to the upside case.
The price needs to hold above $1.40 — the bull flag’s upper boundary and the 50-day SMA — for the setup to remain valid.
The post XRP Price: The Chart Pattern That Last Sparked a 66% Rally Is Back appeared first on CoinCentral.


You May Also Like

Why Ethereum Took a Bigger Hit Than Bitcoin After Trump’s Iran “Stone Ages” Speech

U.S. Senator Bernie Moreno said Clarity Act To be signed before July 4


