

ICP Eyes $5.5 After Three Sell Walls Appear on the Daily Chart
ICP approaches $5.5 as analyst CW8900 charts three sell walls before $4.4 on the 4H, with the daily pointing to a bigger resistance cluster above.
The 4-hour candles told the story first. ICP had been chopping sideways for weeks, then something shifted.
Crypto analyst @CW8900 on X posted Friday that ICP “has almost broken through the first sell wall.” The 4H chart he shared showed price stacking just under $3.5, with a sharp near-vertical volume spike. At the time of posting, ICP was trading near $3.24.
Three Red Zones Before $4.4
CW8900 mapped out three separate sell walls sitting between current price and $4.4. The 4H chart shows distinct red resistance bands at roughly $3.6, $3.8 and $4.2 — each zone where sellers historically stepped in. Green support levels cluster tightly below current price.
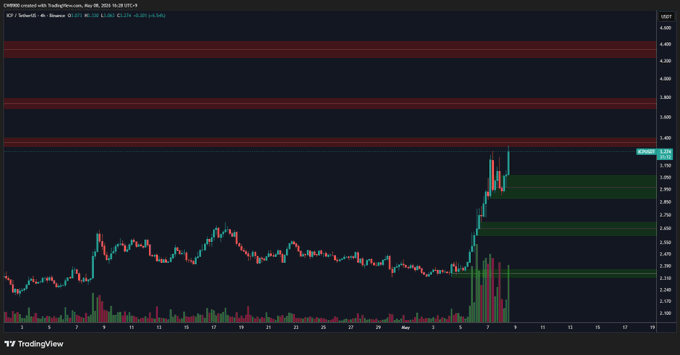
Source : CW8900
Three walls is not one problem. It is three separate ones in a row.
Whether the momentum from the first break carries through all three is the question traders are watching. The volume that accompanied the initial move was notable. It was the kind of spike that either starts something or exhausts itself quickly.
The ICP price structure has tested key resistance bands before without following through. This time the approach looks different on the shorter timeframes.
The Macro Chart Has Its Own Story
Before the 4H walls became the conversation, the 3D chart was already building toward something. A CoinMarketCap community post from analyst @javemarks00 noted that ICP “macro is still broken out and showing signs of major strength.” The 3D chart shared alongside the post shows a descending wedge tightening from late 2023 into early 2026, with price now pushing above the upper trendline on rising volume.
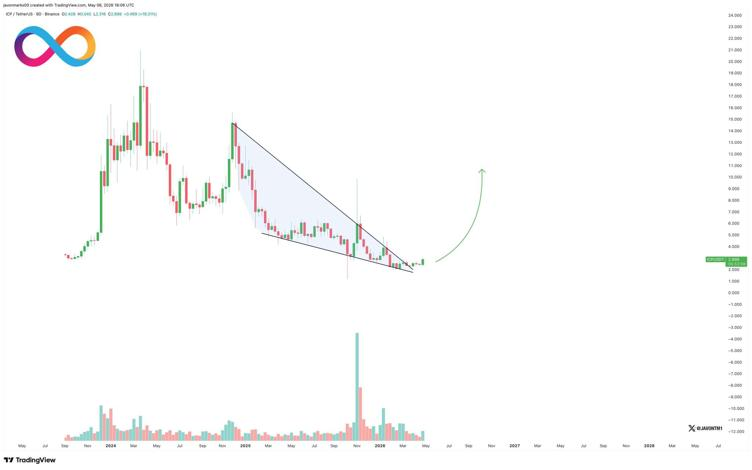
That kind of structure breaking on a longer timeframe does not happen quietly.
The wedge compression lasted over a year. The breakout, if it holds, reframes what the 4H resistance walls actually mean — not as ceiling but as speed bumps on a broader directional move.
The Daily Chart Has a Bigger Story
Zooming out changes the picture entirely. In a separate post, @CW8900 on X shared the 1D chart and placed ICP’s next major sell wall at $5.5. His words: “In the 1D chart perspective, the next sell wall for $ICP is located around $5.5.”
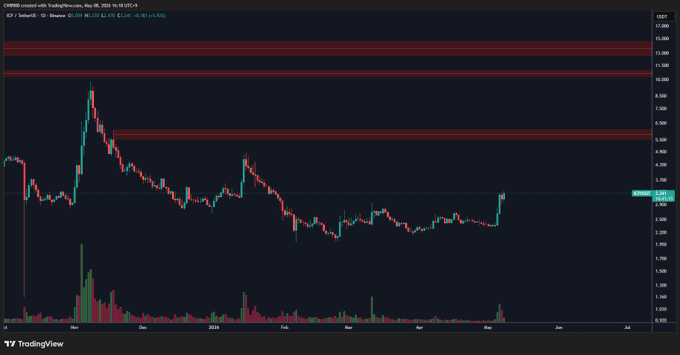
Source: CW8900
The daily shows ICP spent much of 2024 and early 2025 grinding between $2.00 and $2.50. The token saw highs well above $10 in its earlier cycle, then compressed for months.
That $5.5 red zone on the daily is wide. It is not a single price point — it is a region where sellers accumulated positions during ICP’s prior decline. Getting through $4.4 first would need to happen. That part is still not done.
The daily chart also shows additional resistance clusters above $5.5, with heavier red zones visible near $8.5 and further up toward $11. Those are not the immediate conversation.
ICP’s Upbit listing earlier this year opened the token to South Korea’s high-volume trading market, adding a fresh pool of buyers to an asset that had largely traded without major exchange catalysts for months.
The chart as of Friday had the first sell wall partially broken. The second one was already in view.
At $5.5, either the daily resistance gives or it does not.
Disclaimer: This article is based on technical analysis and on-chain commentary from X. It is not financial advice or investment guidance. Pure TA from the cited analyst. Always do your own research.
The post ICP Eyes $5.5 After Three Sell Walls Appear on the Daily Chart appeared first on Live Bitcoin News.


You May Also Like

XRP ETF Holdings Unveiled By $5 Trillion Asset Manager UBS: A Tale Spanning Nine Years

Alex Jones says Trump UFO files a 'psyop to screw with everybody’s brains'


