Ethereum price today holds $2,334 as bulls still lack momentum proof

For now, Ethereum price today points to a market that has stabilized after earlier weakness, but the broader recovery still lacks clear momentum confirmation.
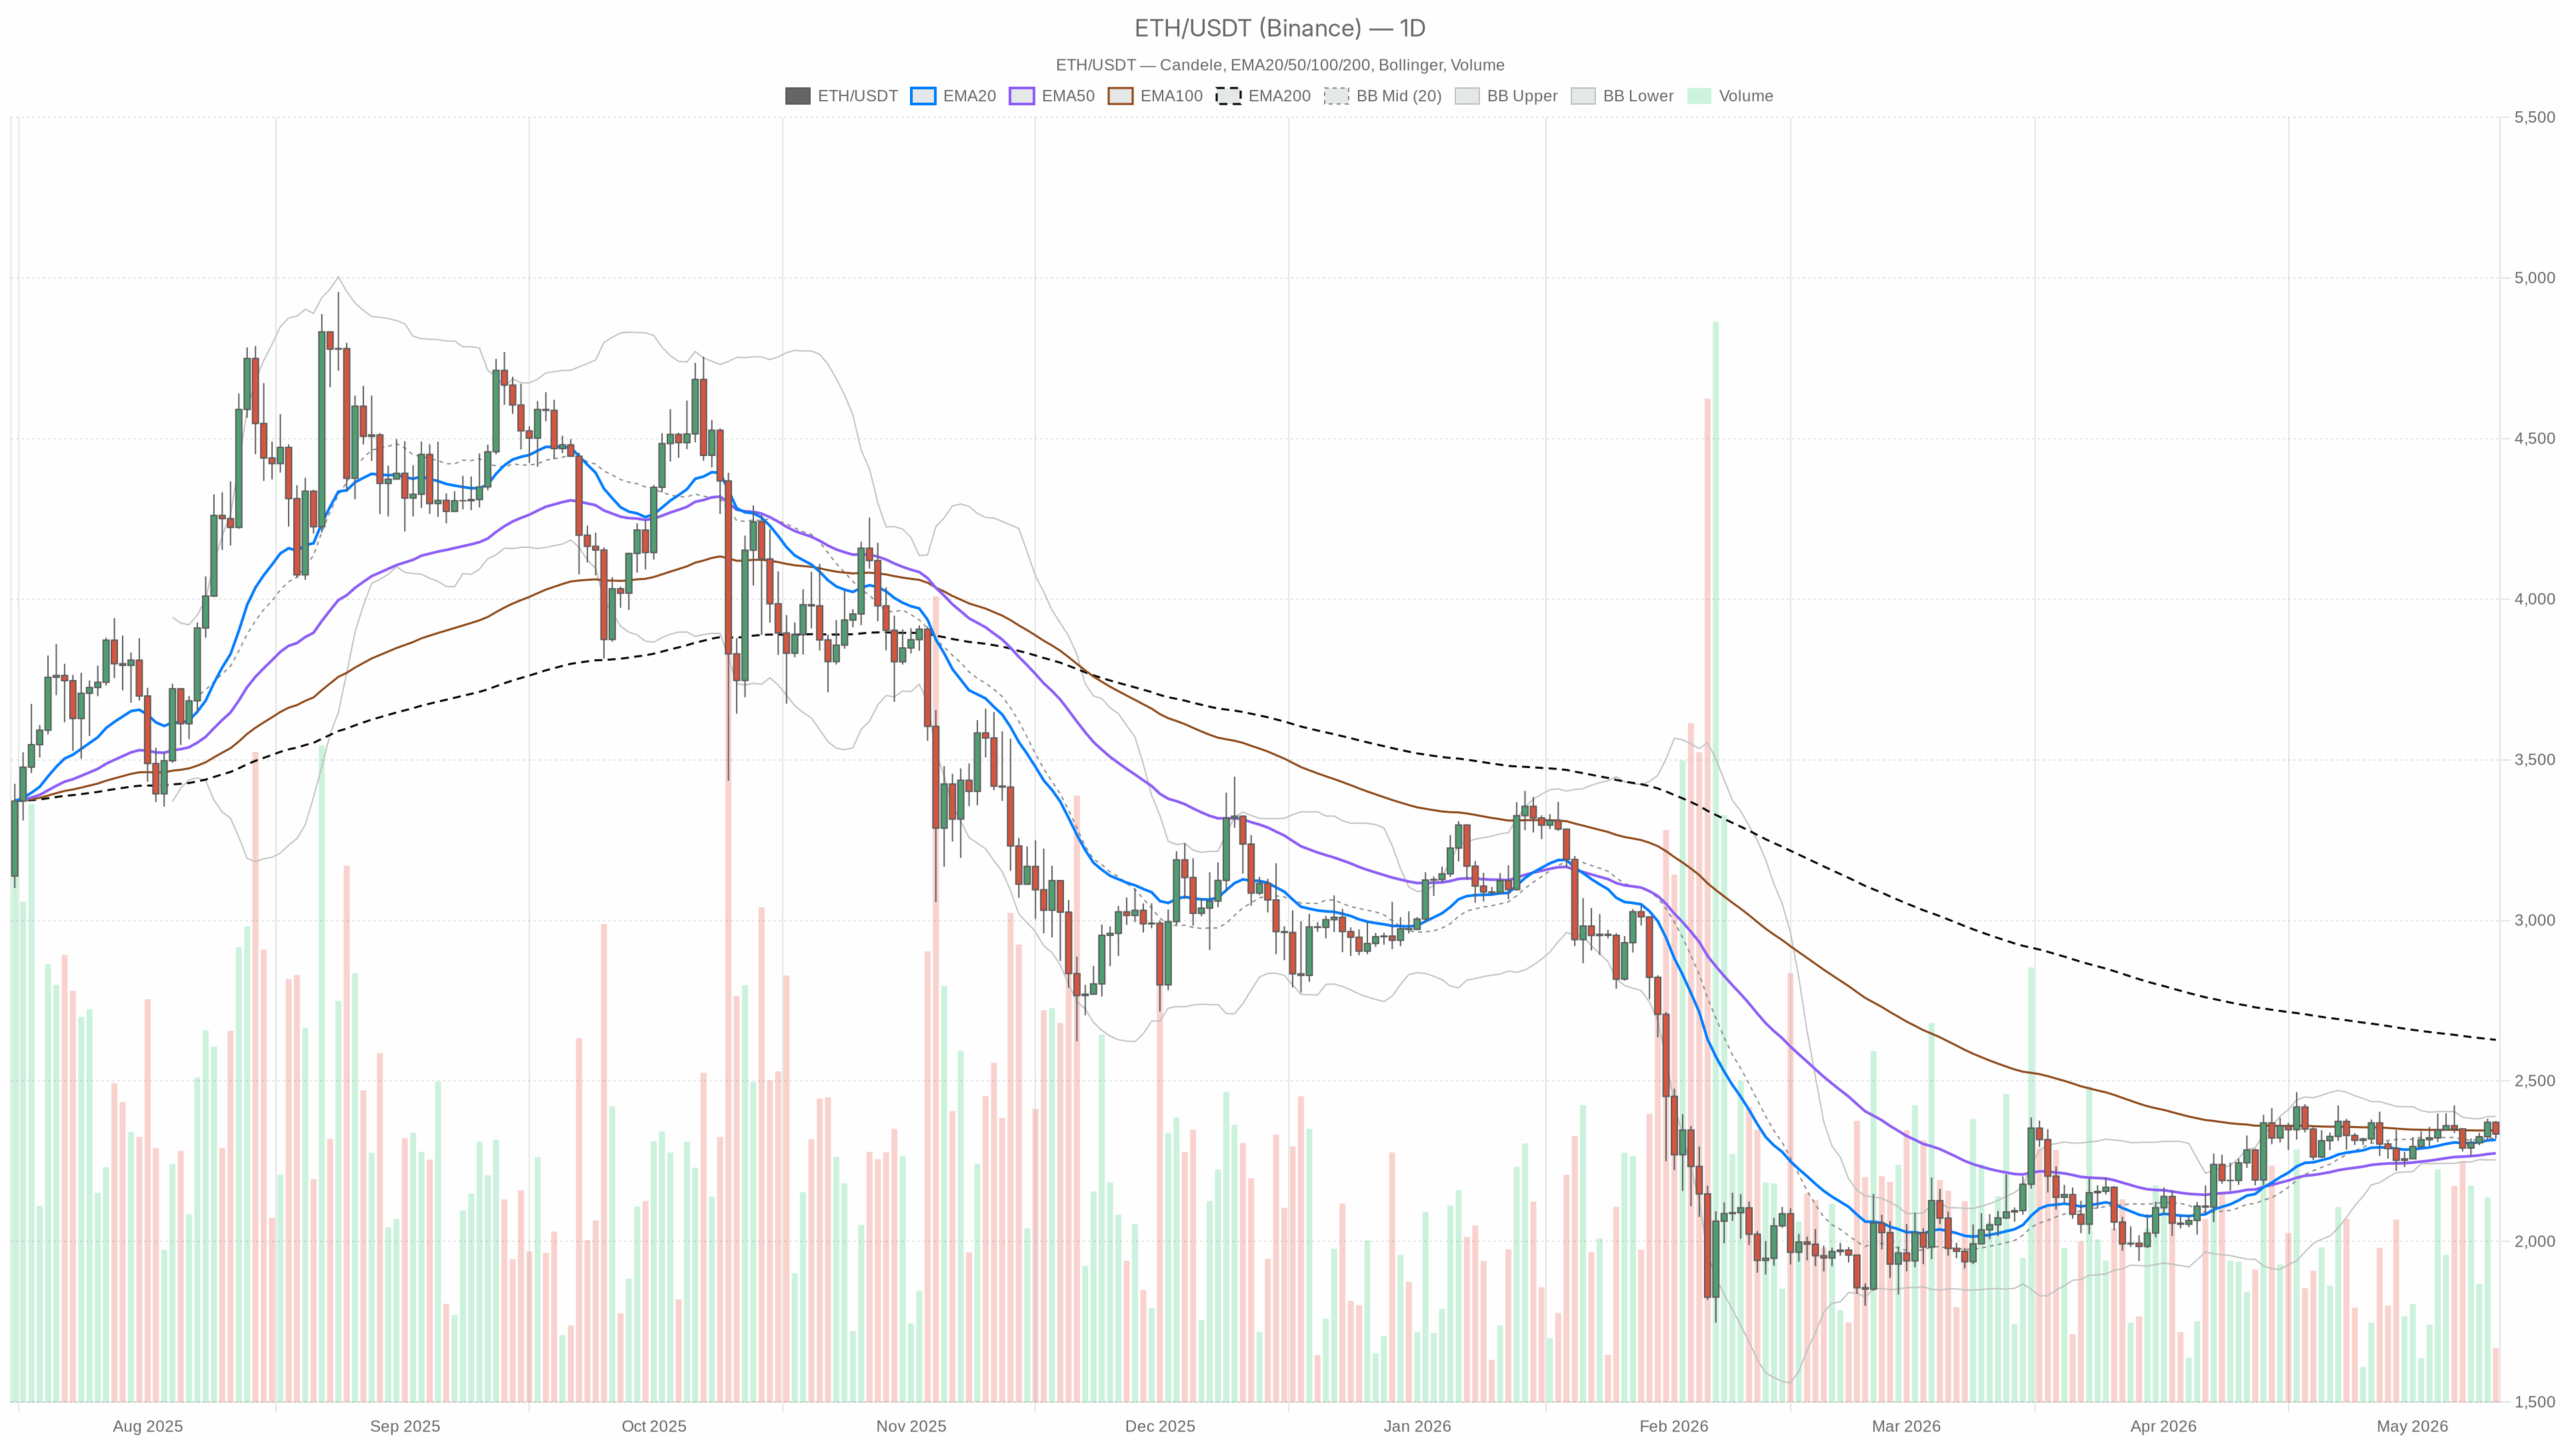 ETH/USDT — daily chart with candlesticks, EMA20/EMA50 and volume.
Main Scenario: Neutral on the Daily Chart
Ethereum is trading around $2,334.71, and the daily chart still leans neutral-to-bullish. Price sits above the 20-day and 50-day EMAs. That tells you buyers have managed to stabilize the market after the earlier weakness.
That said, ETH remains well below the 200-day EMA, so the bigger recovery is incomplete. This is not a clean trend breakout yet. Instead, it is a market trying to build a base while momentum remains hesitant.
What matters now is the tug-of-war between improving structure and fading momentum. On the daily timeframe, Ethereum is holding in the upper half of its recent range. However, the MACD has softened, and price is pressing into nearby resistance rather than expanding cleanly.
In other words, the market is not breaking down, but it also has not earned a full bullish conviction call. As of 2025, that leaves the macro bias fairly clear: neutral, with a slight constructive tilt as long as ETH keeps defending short-term moving averages.
Price is above the 20-day EMA at $2,316.62 and the 50-day EMA at $2,274.78, but still below the 200-day EMA at $2,628.00. That leaves Ethereum caught between short-term recovery and unfinished higher-timeframe damage.
The hourly chart does not fully confirm a fresh upside leg yet. ETH is hovering just under the 20-hour EMA, almost on top of the pivot, and momentum on that timeframe has cooled. Moreover, the 15-minute chart is even more compressed, showing a market that is rotating rather than trending.
Trend Structure and Moving Averages
On the daily chart, ETH is above the 20-day EMA at $2,316.62 and the 50-day EMA at $2,274.78, while remaining below the 200-day EMA at $2,628.00. That combination usually points to an asset that has repaired its short-term structure but has not fully reversed the broader trend.
In plain terms, buyers have improved the chart, but they have not taken control of the bigger picture. On the 1-hour chart, the 20-hour EMA sits at $2,339.05, the 50-hour EMA at $2,333.35, and the 200-hour EMA at $2,325.53.
Price is sandwiched between them, which is classic indecision. That tells you the market is balanced in the short term, not trending with conviction. On the 15-minute chart, ETH is almost flat around the 20-period EMA at $2,334.39.
It is below the 50-period EMA at $2,338.80 and above the 200-period EMA at $2,331.06. Therefore, this is execution territory only: very short-term traders are dealing with noise and mean reversion, not a directional impulse.
RSI and MACD Signals
The daily RSI is 53.46. That is slightly on the positive side of neutral, but nowhere near a strong momentum expansion. It suggests Ethereum has room to move higher, but buyers are not pushing hard enough yet to call it a decisive upside trend.
The 1-hour RSI is 48.18, and the 15-minute RSI is 48.66. Both sit near the middle of the range. That reflects a market that is digesting recent movement rather than building immediate momentum in either direction.
On the daily chart, MACD line is 21.79, below the signal line at 24.65, with a histogram of -2.86. The numbers are not collapsing, but they do show weakening upside momentum.
That is the main warning sign for bulls: Ethereum price today shows improved price structure, yet momentum is still lagging behind. On the 1-hour chart, MACD is softer, with the line at -0.11 against a signal line at 2.95 and a histogram at -3.06.
This tells you intraday momentum has rolled over, which is why ETH keeps stalling instead of breaking higher. Meanwhile, on the 15-minute chart, MACD line is -2.14, signal line -3.27, and histogram 1.13.
That hints at a small short-term recovery attempt, but it is too minor on its own to change the bigger picture.
Bollinger Bands and ATR
On the daily chart, Bollinger Bands are centered around $2,321.82, with the upper band at $2,389.48 and the lower band at $2,254.15. Price is trading slightly above the mid-band and not far from the upper band.
That shows ETH is leaning toward the upper part of its recent range, but it has not broken into a volatility expansion phase yet. On the 1-hour chart, the mid-band is $2,345.27, the upper band is $2,375.37, and the lower band is $2,315.18.
Price is below the mid-band and closer to the lower half of this intraday range. Therefore, short-term pressure looks slightly heavier than the daily chart alone would suggest. On the 15-minute chart, the bands are tight, with a mid-band at $2,333.36.
The upper band stands at $2,339.52, and the lower band sits at $2,327.20. Compressed bands usually mean the market is waiting for a trigger rather than already moving.
The daily ATR is 66.18, which means ETH is still moving enough to matter, but not in panic mode. This is a normal swing environment where levels matter and breakouts need follow-through.
The 1-hour ATR is 19.93, while the 15-minute ATR is 5.18. As a result, short-term volatility is relatively contained, which fits the current consolidation and explains why price keeps snapping back toward the middle.
Pivot Levels to Watch
On the daily timeframe, the main pivot sits at $2,343.21, with resistance at $2,366.42 and support at $2,311.51. ETH is trading just below the daily pivot.
That keeps the market on the fence. Reclaiming and holding above the pivot would strengthen the bullish case, while repeated failure below it keeps the range intact. On the 1-hour timeframe, the pivot is $2,334.09.
Resistance stands at $2,337.93, and support is $2,330.88. Price is almost exactly on top of this area. Consequently, this is the immediate battleground, and whichever side wins it likely sets the next short intraday push.
On the 15-minute timeframe, pivot is $2,334.86, with resistance at $2,336.68 and support at $2,332.89. That confirms how compressed the market is right now: very short-term price action is balanced and highly reactive.
Bullish and Bearish Scenarios
The bullish path stays alive if ETH can hold above the $2,316-$2,311 support zone and reclaim the daily pivot around $2,343. Then it would need enough strength to challenge $2,366 and the upper daily Bollinger area near $2,389.
If that happens while hourly momentum turns back up, the market can start building a more credible continuation leg. For bulls, the big prize would be a sustained push that starts reducing the distance to the 200-day EMA at $2,628.
The bullish case is invalidated if ETH loses the 20-day EMA and slips back under $2,311 with follow-through. At that point, the recent recovery starts to look more like a failed bounce than a base.
The bearish case comes into focus if Ethereum keeps failing under the daily pivot and short-term sellers drag price below $2,311. That would open the door toward the lower daily Bollinger region near $2,254 and potentially the 50-day EMA around $2,275.
That outcome would fit the current MACD weakness and confirm that momentum never matched the earlier price stabilization. However, the bearish view is invalidated if ETH reclaims $2,343, pushes through $2,366, and starts holding above those levels instead of rejecting them.
Positioning and Risk
ETH is not in a clean directional market right now. The daily chart says the structure is improving, but the hourly chart says momentum still needs to prove itself. That tension matters.
It means chasing strength too early can be just as risky as pressing shorts into support. For positioning, this is the kind of environment where traders usually need confirmation rather than prediction.
Volatility is present but not extreme, and the market is compressed enough that false breaks are a real risk. In summary, until ETH either clears nearby resistance with momentum or loses support with conviction, the market remains balanced, reactive, and vulnerable to sharp but short-lived moves.


You May Also Like

Shiba Inu Breaks $0.0000066 as Net Long Positions Jump

Why Businesses Need Professional Machine Design and Development Services