

Virgin Galactic Stock jumps to 4.53 as 36.6M shares fuel breakout

Virgin Galactic Stock ripped to 4.53, clearing all key moving averages and entering an acceleration phase. The daily bias has turned bullish yet stretched, with price outside the band and momentum overbought. A digestion phase is likely before any sustainable next leg.
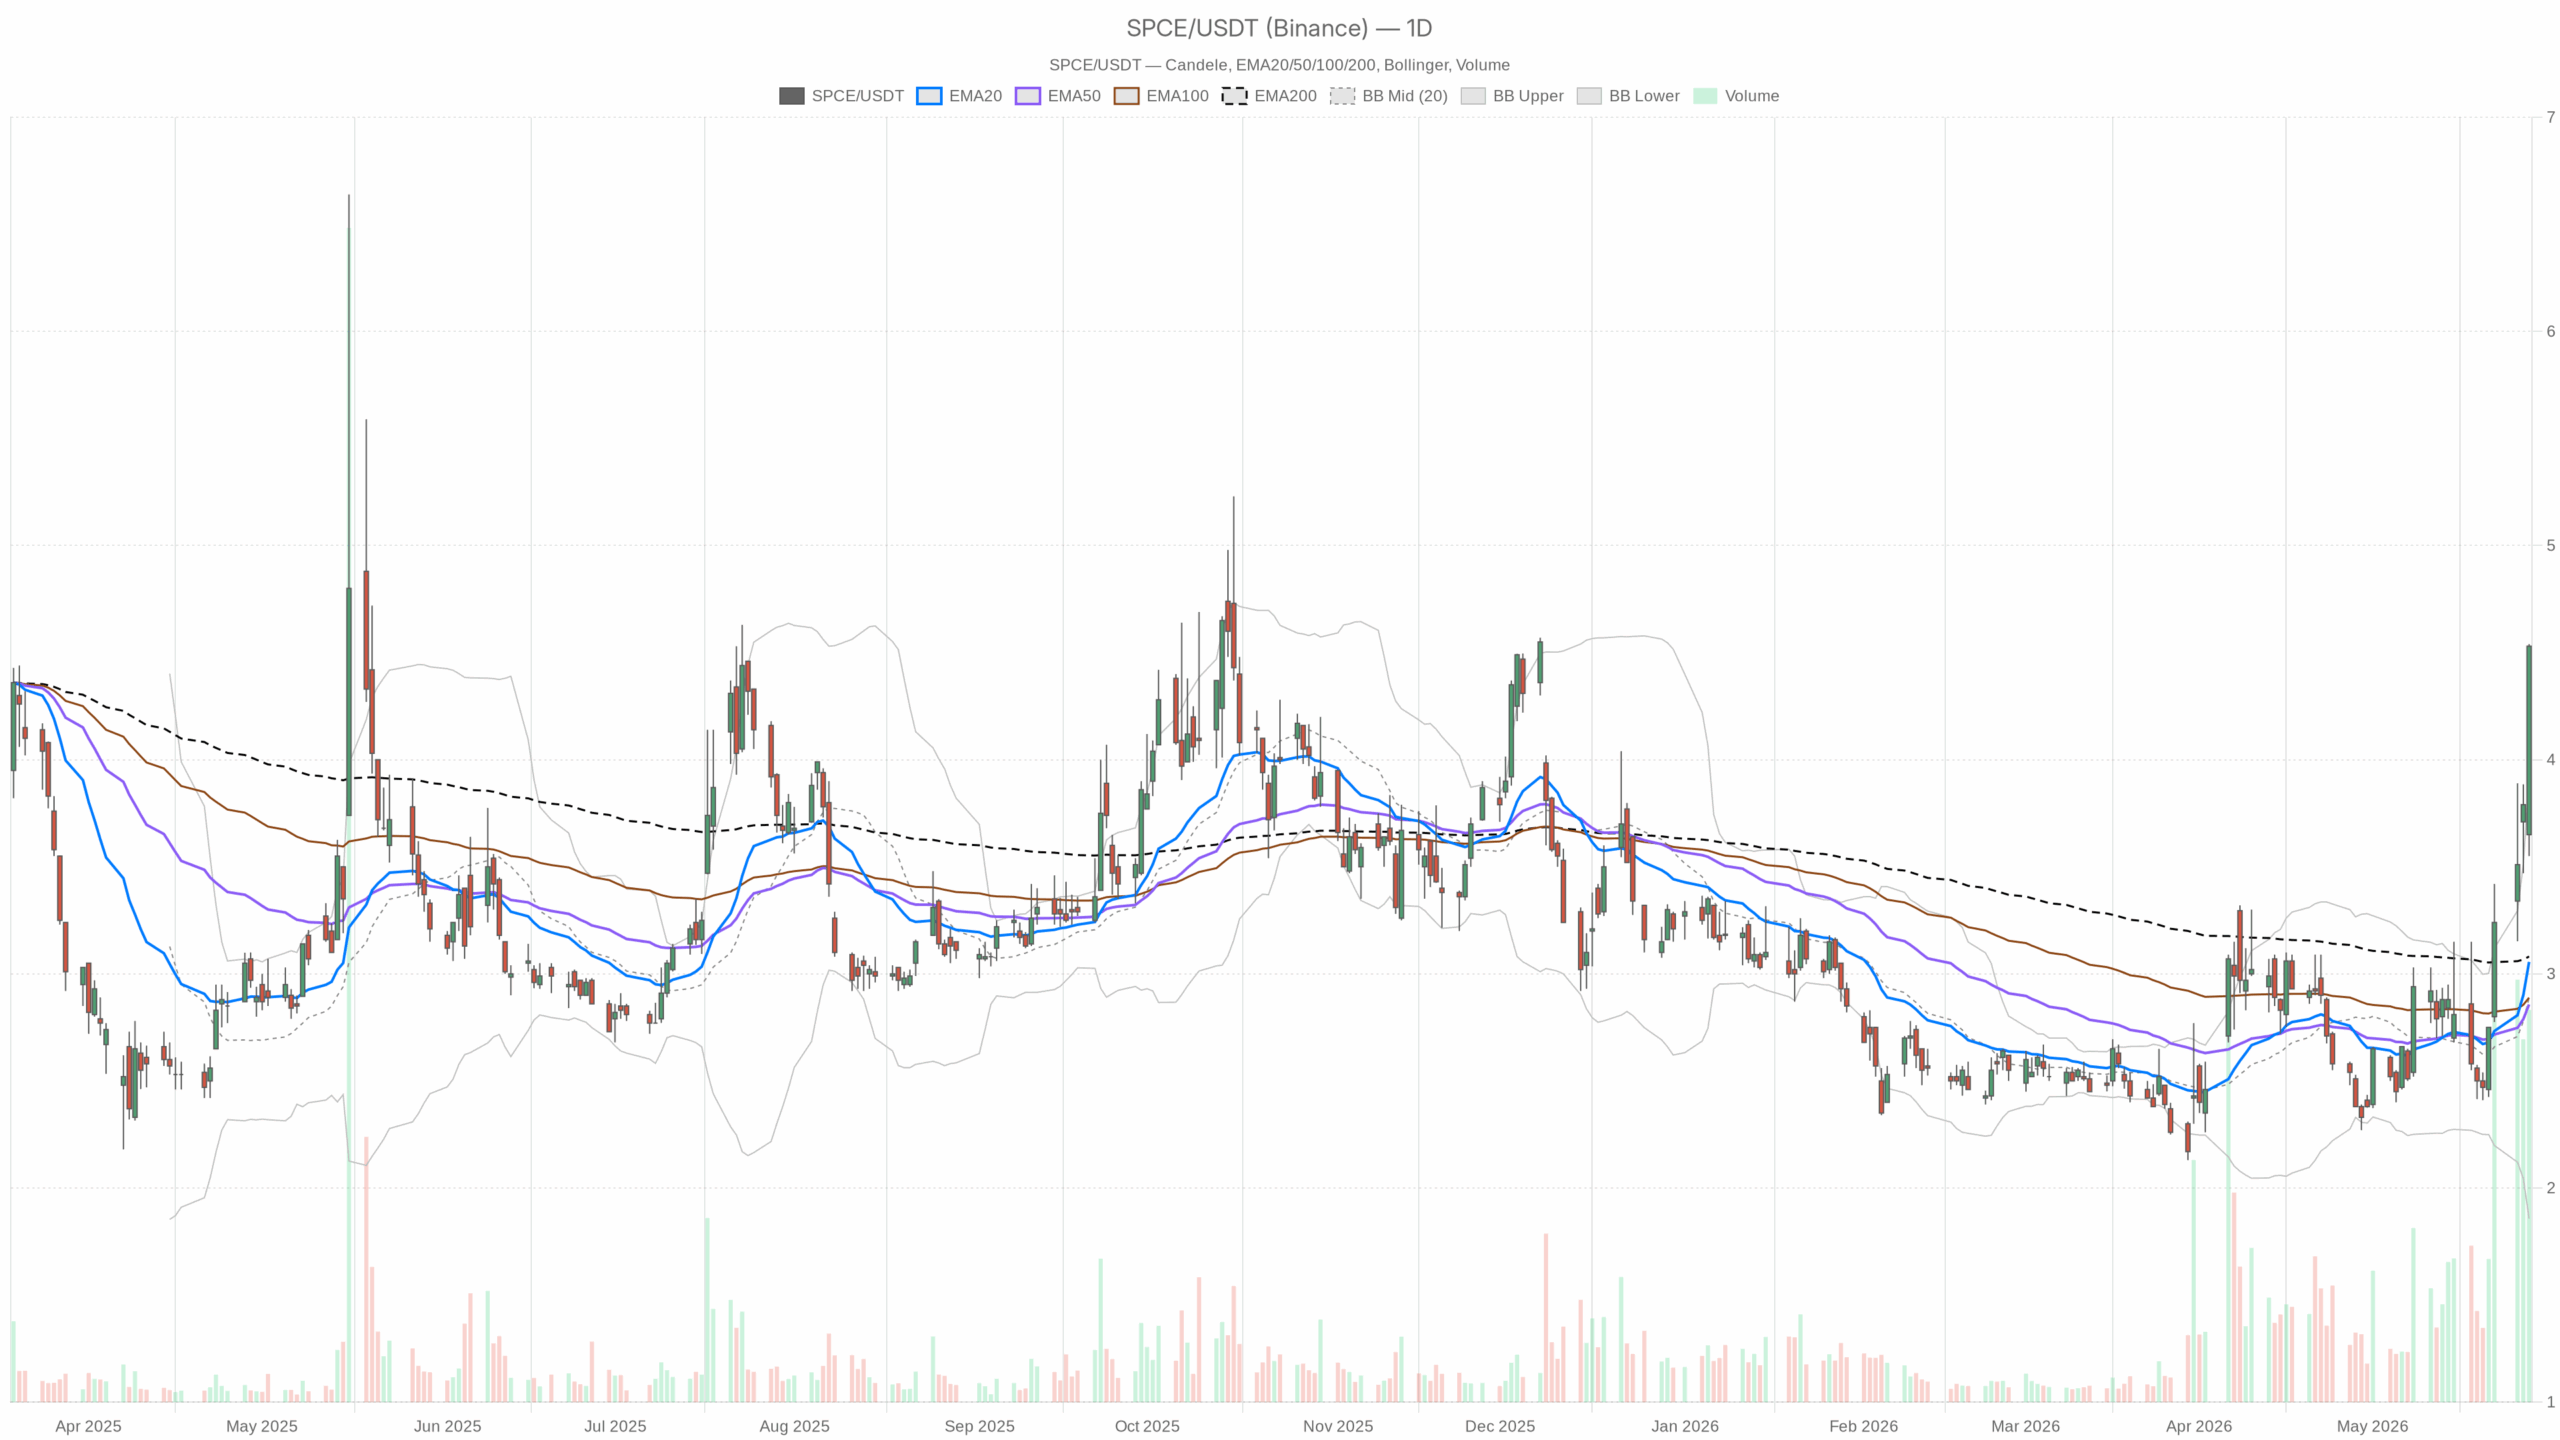 SPCE — daily chart with candlesticks, EMA20/EMA50 and volume.
Daily Technical Outlook for Virgin Galactic Stock
On the daily timeframe, SPCE closed at 4.53 on 36.6M shares. High volume underscores strong participation and possible short covering. EMAs: 20‑day 3.06, 50‑day 2.86, 200‑day 3.08. Price is well above all three, marking a trend inflection higher.
RSI14 78.83 is overbought and increases pullback risk. MACD line 0.27 vs signal 0.10 with a 0.17 histogram keeps bullish momentum in gear. Bollinger Bands: mid 2.89, upper 3.92, lower 1.86. Price stands above the upper band, indicating a squeeze and potential mean reversion.
ATR14 0.42 shows elevated daily volatility. The daily pivot is 4.21 with R1 4.86 and S1 3.87. Therefore, 4.21 is first support, while 4.86 is the immediate upside magnet. Notably, the daily regime flag prints neutral, confirming a fresh breakout rather than a mature uptrend.
Intraday Structure: 1‑Hour Trend and Levels
On the 1‑hour chart, the regime is bullish. EMA20 3.80, EMA50 3.38, EMA200 2.90. The intraday trend stack is strongly positive.
RSI14 82.48 shows stretched intraday momentum. MACD line 0.30 vs signal 0.25 with a 0.06 histogram remains positive but is losing incremental thrust. Bollinger mid 3.78 and upper 4.35. Price near 4.51 is riding above the band, which often precedes cooling.
Hourly ATR14 is 0.21, so swings within the session are wide. The hourly pivot is 4.48 with R1 4.57 and S1 4.42. Therefore, 4.48–4.42 is the immediate battle zone.
15‑Minute Setup: Constructive but Extended
The 15‑minute picture remains constructive but extended. EMA20 4.14, EMA50 3.89, EMA200 3.32, keeping the short‑term trend firmly up. RSI14 at 83.28 is very overbought into resistance. MACD line 0.20 vs signal 0.15 with a 0.05 histogram is positive yet flattening.
Bollinger mid 4.07 and upper 4.62. Price near the upper band leaves little room before sellers test resolve. ATR14 is 0.11, so tactical stops need room. The 15‑minute pivot is 4.50 with R1 4.55 and S1 4.46, framing near‑term entries and fades.
News and Fundamentals Driving Virgin Galactic Stock
Fresh headlines are helping the tape. Virgin Galactic highlighted Delta vehicle progress and reopened $750k tickets. A new research mission will study menstruation in microgravity. These items reinforce the product pipeline and demand narrative.
First‑quarter revenue was $227k versus $461k a year ago. Net loss narrowed to $64.72M, and EPS improved to -$0.81 from -$2.38. Financials remain early‑stage, so the rally leans on story and execution milestones rather than near‑term cash flow.
Bullish Scenario: Consolidation Above Pivots, Then Continuation
Consequently, the bullish path is to consolidate above the daily pivot at 4.21, then build acceptance over the hourly pivot at 4.48. Holding these supports would keep trend control with buyers. A push through 4.57 and then 4.86 would confirm continuation, aligning with the hourly R1 and daily R1.
Momentum Reset Criteria
Ideally, RSI cools toward the 60s while price holds higher lows. That would reset momentum without breaking structure. MACD staying positive on daily and hourly charts would support the case and signal trend persistence.
Bearish Scenario: Mean Reversion and Exhaustion Signals
On the other hand, failure to hold 4.48–4.42 opens a mean reversion toward 4.21 and 3.87, the daily pivot and S1. A daily close back inside the upper Bollinger band with a rolling MACD histogram would weaken the breakout and flag momentum exhaustion.
In contrast, a deeper fade could extend toward the 20‑day EMA near 3.06 if sentiment flips. That zone is the larger support after a parabolic burst.
Risk Context and Trading Considerations for SPCE
Overall, positioning should respect the elevated ATR and the overbought state. Pullbacks can be abrupt, and ranges can expand quickly. Until the daily regime flips from neutral to firmly bullish, expect two‑way trade around the pivots. Meanwhile, headline sensitivity remains high for Virgin Galactic Stock.


You May Also Like

NetApp (NTAP) Stock Rockets 33% As AI Demand Powers Record Revenue

BlackRock’s Monumental $121.1M Bitcoin and Ethereum Move to Coinbase Prime Signals Unstoppable Institutional Adoption

NetApp (NTAP) Stock Soars 33% on AI-Fueled Revenue Surge and Strong Guidance



