

Bitcoin Price Today Slides Below $63,000 Amid Extreme Fear—Is the Market Bottom Near or Just a Trap?

Market sentiment is grim as bitcoin price today falls to $62,828 amid extreme fear, signaling a highly uncertain outlook. The Fear & Greed Index sunk to 12, a level suggesting capitulation events that sometimes mark market bottoms but often trap sellers.
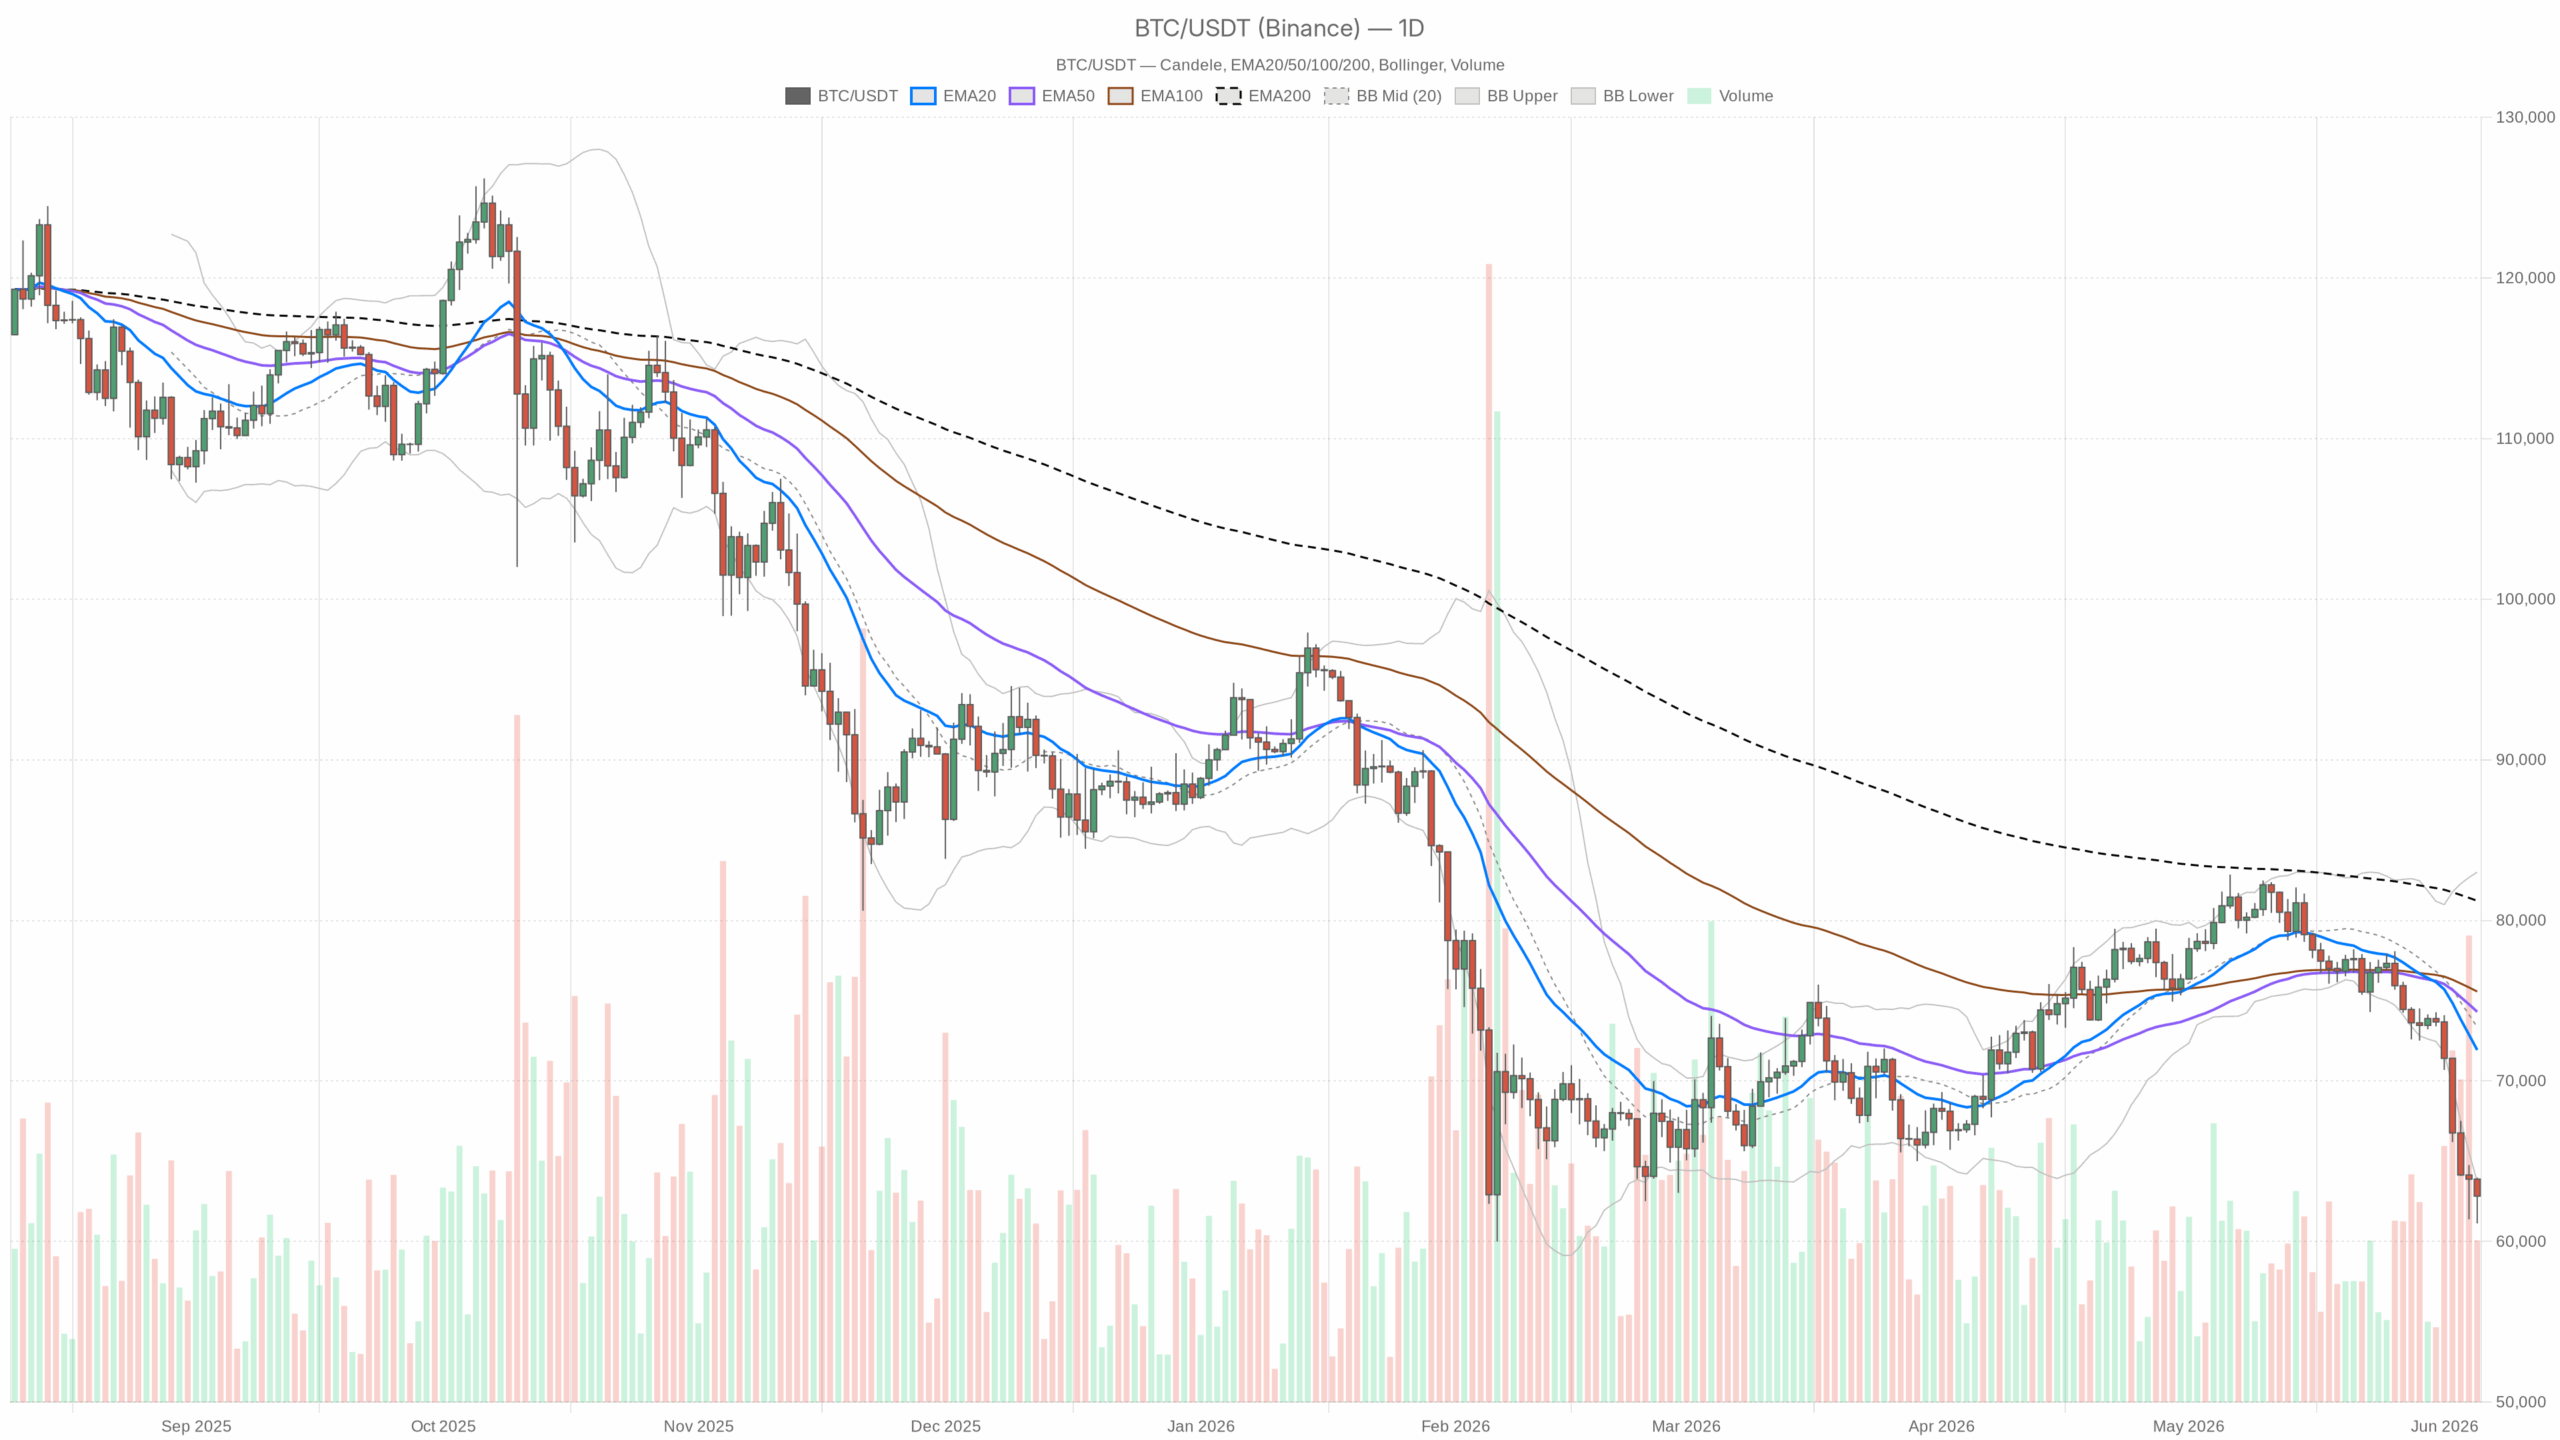 BTC/USDT — daily chart with candlesticks, EMA20/EMA50 and volume.
The Daily Picture: A Market in Structural Breakdown
The daily chart confirms a bearish regime. Bitcoin trades significantly below all major moving averages: the 20-day EMA at $71,924, the 50-day at $74,303, and the 200-day at $81,215. This wide gap highlights a full structural breakdown rather than a routine pullback, indicating a loss of trend integrity.
The daily RSI at 17.27 is among the most oversold in years, reflecting intense selling pressure and exhaustion. Although this does not guarantee a bottom yet, it suggests room for a mean-reversion bounce when conditions normalize.
MACD readings remain deeply negative with momentum accelerating downwards. The daily histogram is widening negatively, and no bullish crossover appears, reinforcing continued seller control.
Prices are trading below the lower Bollinger Band at $63,718, a rare and bearish condition turning that band into resistance. Elevated volatility is confirmed by an Average True Range of $2,425, implying substantial intraday swings and heightened risk.
Immediate price pivots place support at $61,310, with resistance near $63,162. Bitcoin currently clings around the pivot point, marking a precarious balance with a drop below support likely to signal further steep declines.
Hourly Chart: A Flicker of Stabilization, But Nothing More
On the hourly timeframe, bitcoin price today closed at $62,825 below the 20 EMA of $63,250 and 50 EMA of $64,477, with a bearish classification intact. A minor positive MACD histogram crossover hints at some fading selling momentum, but with the RSI at 44.68, the market remains in short-term relief mode without buyer control. Price trades near the lower Bollinger Band, reinforcing cautious stabilization rather than a strong bounce.
15-Minute: The Only Bright Spot — and a Very Small One
The 15-minute chart reveals a neutral regime, with RSI at 51.2 and a positive MACD histogram. Bitcoin at $62,853 slightly above the 15-minute EMA20 points to tentative short-covering. However, this is merely intraday noise within the broader daily breakdown until confirmed by stable moves through near-term pivots.
Market Context: This Isn’t Just a Bitcoin Problem
Bitcoin dominance remains relatively strong at 56.22%, implying altcoins are suffering even more amid this downturn. The total crypto market cap fell to $2.24 trillion, down 2.07% in 24 hours, while trading volume plunged nearly 69%, signaling liquidity contraction rather than healthy selling.
Recent institutional activity has turned negative following Strategy’s equity sale, plus rising ETF outflows and competition from IPOs for capital. Bitcoin underperforming equities by the widest margin since 2019 underscores risk capital rotation away from crypto and deep macro headwinds.
On decentralized exchanges like Uniswap, fee spikes suggest increased hedging and risk management, not buying enthusiasm, confirming trader repositioning rather than accumulation.
The Bullish Scenario
A meaningful bounce would hinge on mean reversion from these extreme oversold levels. Historically, daily RSI below 20 often precedes 10–20% recoveries over weeks. Holding above the $61,310 support and hourly closes over $63,250 could enable a move toward $65,000–$67,000. A daily close above the lower Bollinger Band at $63,718 would confirm moderating breakdown conditions. This scenario fails if price decisively breaks below $61,310.
The Bearish Scenario
The easier path is downward. Being below major EMAs, with accelerating negative momentum and macro pressures like ETF outflows and fading institutional demand, supports further declines. A confirmed close below $61,310 would open a technical vacuum toward the $58,000–$59,000 zone. The breached Bollinger Band floor removes a key support level, making downside risk more pronounced. Only a strong daily reversal above $63,718 would invalidate this bearish view.
How to Think About Positioning Here
Two plausible narratives with comparable short-term conviction create a demanding environment for positioning. An RSI at 17 warns against fading extremes recklessly. Likewise, short-side chasing carries risk due to potential violent bounces from overstretched conditions. The daily ATR of $2,425 underscores the need for strict risk management amid elevated volatility.
Traders must monitor $61,310 support, hourly closes around $63,250, and especially volume on any recovery attempt. Thin-volume bounces in this setting tend to be traps rather than genuine reversals.
This analysis is based on publicly available data as of June 5, 2026. It reflects the author’s interpretation for informational purposes only.


You May Also Like

Bitcoin, Gold, and U.S. Stocks Dive as Trump Pledges to Hit Iran ‘Extremely Hard’

Q2 Market Insights: Bitcoin regains dominance in risk-averse environment, ETFs remain critical to market structure

This Cheap Crypto Is Compared to Early Binance Coin (BNB), Here’s Why


