

Marvell Stock jumps 32% as Huang calls it a future trillion-dollar winner

Marvell stock surged aggressively on June 4, closing at $316.43 after hitting an intraday high of $321.50. This momentum-driven move highlights strong bullish sentiment, fueled by Nvidia CEO Jensen Huang dubbing Marvell as the next trillion-dollar company. However, the current overbought readings demand careful attention from traders and investors.
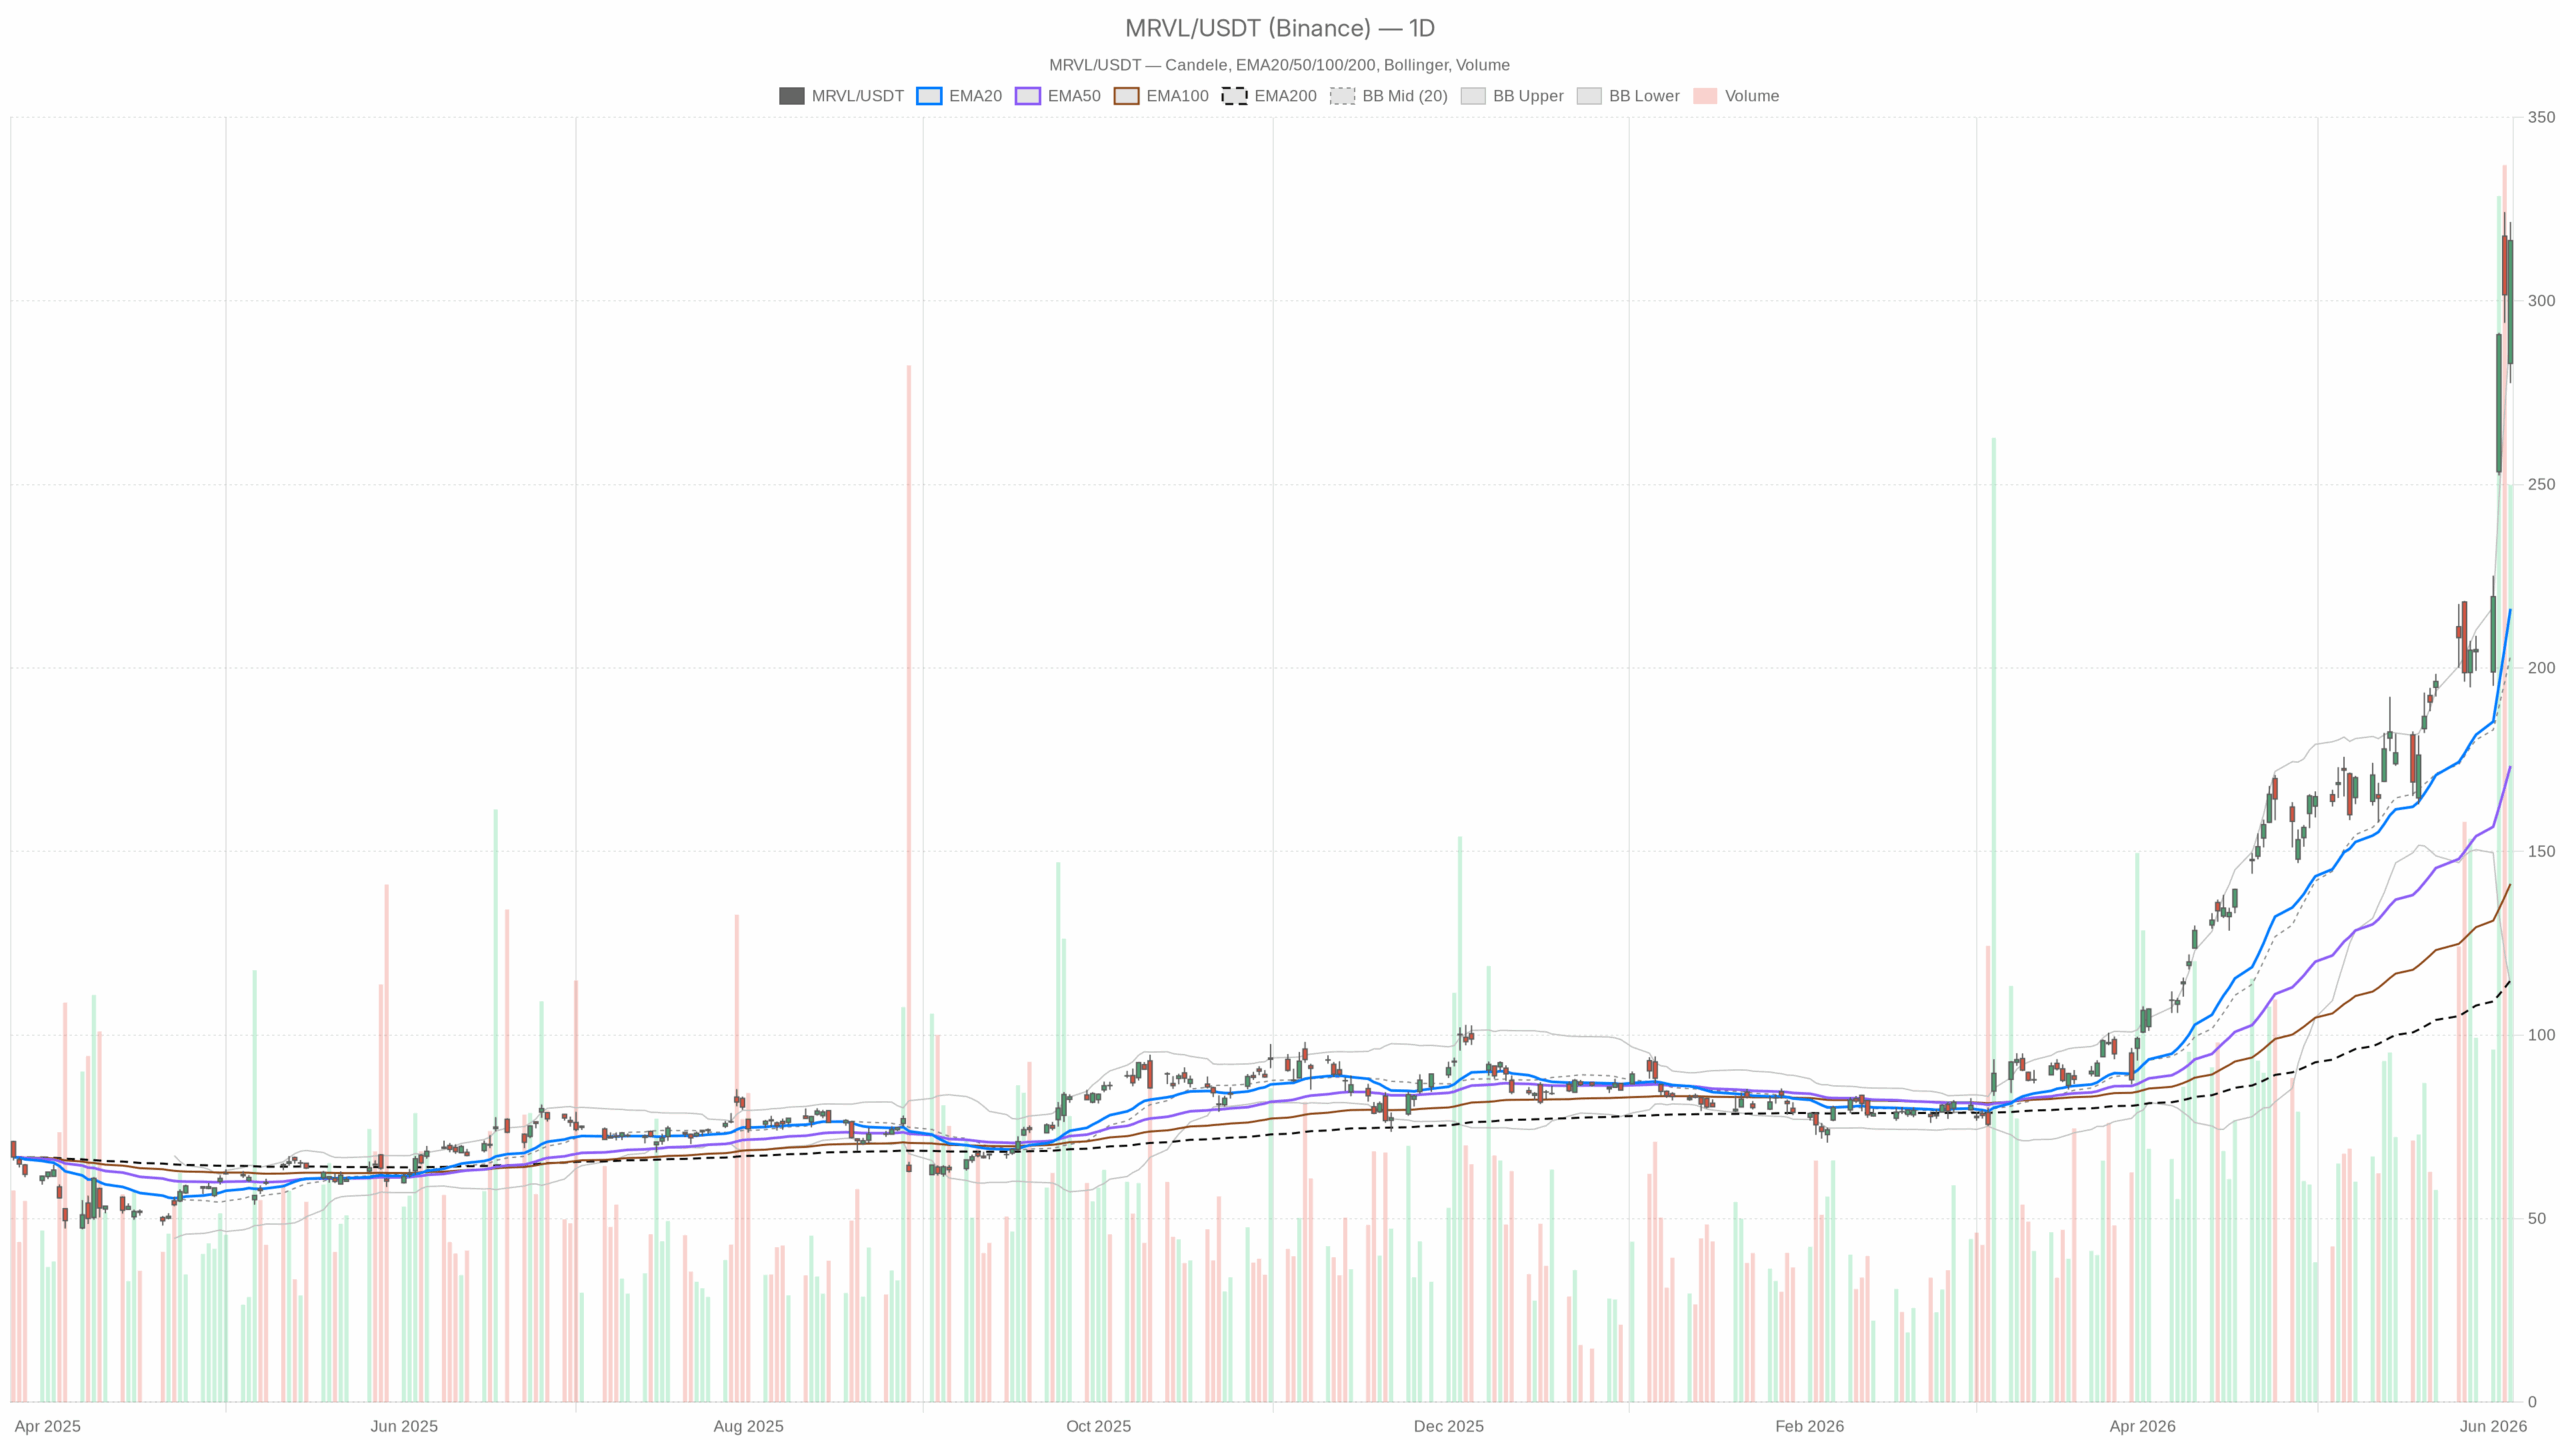 MRVL — daily chart with candlesticks, EMA20/EMA50 and volume.
Marvell Stock Daily Bias: Aggressively Bullish but Overextended
At the daily level, Marvell stock shows a dominant trend. The price is well above the EMA20 at $216.11, EMA50 at $173.31, and EMA200 at $114.89, confirming a structurally bullish regime. The substantial gap between the current price and these moving averages underscores the stock’s strong upward momentum.
The daily MACD supports this bullish momentum with a line value of 34.03 against a signal of 22.13 and a histogram at 11.90, reflecting accelerating momentum. Yet, such high MACD values also indicate a move that has already traveled far. This signals that while strength remains, the margin for error tightens.
Most notably, the daily RSI reading at 88.06 is historically high, signaling extreme overbought conditions. Readings this elevated usually precede either a sharp consolidation or reversal, contingent on whether the fundamental narrative sustains. Marvell’s strong AI infrastructure narrative and Jensen Huang’s endorsement provide this vital backdrop, although the stock price has already factored in substantial optimism.
Bollinger Bands reaffirm the extension. The stock closed above the upper band level of $292.94, trading entirely outside the bands, which suggests heightened momentum but often leads to at least a partial mean reversion. The daily mid-band at $203.35 lies far below current prices, confirming expanded volatility. The ATR of $23.06 reflects routine swings of this wide magnitude in daily sessions.
Daily pivot analysis shows a pivot point at $305.17, with resistance at $332.76 and support at $288.85. Although the stock closed above the pivot, the $28 range between support and price reveals significant air below current levels.
Hourly Chart: Momentum Showing Signs of Plateau
Hourly technicals maintain a bullish trend but suggest momentum is peaking. Price remains above the EMA20 ($294.81), EMA50 ($259.47), and EMA200 ($199.95), confirming short-term structural support. However, the hourly MACD has formed a bearish crossover, with the MACD line at 20.53 falling below the signal of 21.95 and a negative histogram of -1.42. This signals the immediate momentum driving today’s surge is beginning to wane.
The hourly RSI at 71.86 remains overbought but has pulled back from peak intraday highs near $321.50. Price hovers between the Bollinger Bands’ midline ($301.52) and upper band ($327.12), indicating a healthy position within the trend but limited room for upward extension before facing resistance.
This setup indicates a natural momentum cooldown, not a reversal or trend invalidation. Traders should approach new entries cautiously, recognizing that the hourly momentum surge is pausing after a strong run.
15-Minute Timeframe: Signs of Short-Term Stabilization
On the 15-minute chart, the outlook is more balanced. The RSI at 58.20 sits in neutral territory after recovering from oversold conditions caused by an intraday pullback from $321.50 to $301.65. The MACD line (4.38) closely matches the signal (4.28), with a minimal histogram of 0.10, suggesting indecision or stabilization.
The price remains supported by the 15-minute EMA20 at $312.47 and EMA50 at $302.63, anchoring short-term strength. The pivot level at $312.00, resistance at $322.35, and support at $306.03 frame the trading range. Closing near $316.38 between these points suggests the market is digesting the recent move rather than extending further immediately.
Marvell Stock’s Bullish Case: The Trillion-Dollar Narrative Drives Price
The bullish thesis for Marvell stock rests on two key pillars. First, all major timeframes maintain an upward price structure, with no signs of bearish price action. Second, the qualitative catalyst is powerful: Jensen Huang’s endorsement as a potential trillion-dollar company lends credibility unmatched by typical analyst commentary. Marvell’s exposure to AI custom silicon and sustained data center demand reinforce this secular growth story.
Holding above the daily pivot at $305.17 is critical to maintaining this bullish trajectory. A push toward resistance at $332.76 remains possible if consolidation occurs above this level. Moreover, a weekly close above $320 would boost institutional confidence. Continued commentary supporting data center spending or new design wins could further propel the stock.
Bearish Risks: Consensus Overreach and Positioning Vulnerabilities
Despite the strong narrative, the bearish case centers on the risk of consensus exhaustion. With the daily RSI reaching 88.06, Marvell stands as one of the most overbought large-cap stocks. A recent analysis highlighted that Marvell stock is a consensus trade, where most participants have already priced in the positive outlook. The 32% jump following Huang’s comments reflects pre-positioning by traders.
This heightens the risk that the marginal buyer may be scarce going forward. External shocks, such as geopolitical tensions, could exacerbate this. If the stock drops below the $305 pivot, the first target would be the upper Bollinger Band near $292.94, equating to a 7-8% pullback. While technically minor, this decline would be painful. A deeper correction toward the EMA20 near $216 would signify a fundamental disruption of the AI growth narrative.
Key Levels and Volatility: Positioning for Next Moves in Marvell Stock
Marvell stock trades in a structurally dominant uptrend with historically extreme momentum. The daily chart shows bullish dominance, hourly momentum is cooling, and the 15-minute chart implies short-term equilibrium. This multi-timeframe conflict represents a natural transition between initial explosive gains and the market’s next phase—either consolidation preparing for higher levels or a corrective shakeout.
Volatility remains elevated, with the daily ATR at $23 and hourly ATR at $13. Position sizing and stop placement must account for this environment. Stops set just below $305 carry a higher risk of being triggered by routine intraday swings. On the upside, surpassing $322.35 could ignite a fresh momentum leg. The market will watch these critical levels closely. In such an extended move, what matters most is where the stock stabilizes in coming sessions, not the direction of the immediate 5% fluctuation.


You May Also Like

Eltropy Named to Inc. Regionals Pacific 2026 List of Fastest-Growing Private Companies

Solana price confirms bearish crossover following Drift exploit, will it crash?

Fed Governor Calls For Strong Stablecoin Oversight As CLARITY Act’s Final Text Gets Delayed


Trending News
More24/7 Live News
MoreQuick Reads
More
