

BTC Losing Historic $60K Support Could Spark $1.2B Shock Before Bull Run
BTC trades below $60K as Deribit cites $1.2B in open interest and traders watch the 200-week moving average for support.
Bitcoin fell near $59,357 on the Bitstamp daily chart, placing the $60,000 area back in focus.
Traders are now watching historic support, options exposure, and weak momentum before any possible bull run.
Bitcoin Tests 200-Week Moving Average
Bitcoin has reached its 200-week moving average, a level watched during past bear markets.
This area acted as major support in 2015 and 2018. In both cycles, Bitcoin later entered long recovery phases.
However, the level has not always held cleanly. In 2022, Bitcoin briefly traded below the 200-week moving average. The market later found its cycle low after that breakdown.
The current move has drawn comparisons with the 2022 bear market structure. That prior break also happened in June.
This timing has added attention to the present decline. Analysts are still treating the level as a macro reference point.
It is not being viewed as a direct trading signal. Price action, Elliott Wave structures, and support levels remain key for confirmation.
Deribit Executive Flags $1.2B Options Risk
CoinDesk reported that Deribit CCO Jean-David Péquignot called $60,000 a key Bitcoin level.
He said more than $1.2 billion in notional open interest sits at that put strike. The data was tied to Deribit options.
A break below $60,000 could force market makers to adjust hedges. Péquignot said short gamma exposure may lead them to sell spot or futures.
That selling could add pressure during a fast move.
High leverage may also raise liquidation risk. Long positions can be forced out when price drops below key levels.
This process can increase selling during sharp market moves. The $60,000 level is now both technical and options-related.
It has value as historic support and as a large derivatives zone. That mix keeps traders focused on daily closes below the mark.
Read Also:
Technical Indicators Point to Weak Momentum
Bitcoin has also broken below the 1.0 Fibonacci level near $61,898. That area marked the lower end of a larger retracement range.
A daily close below it would confirm more weakness. BTC has already lost the 0.786 Fibonacci level at $74,730.
It also failed to reclaim the 0.618 level near $84,803. Sellers remain active while price trades below these levels.
The MACD remains bearish on the daily chart. The MACD line is below the signal line. The histogram is also negative, showing continued downside momentum.
The RSI is near 14.34, which shows oversold conditions. However, oversold readings do not always bring quick rebounds. A move back above 30 would suggest early short-term relief.
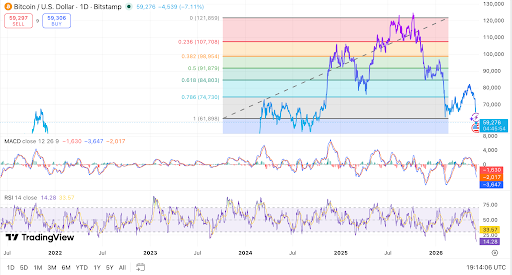 Bitcoin trades below $60,000 as bearish indicators deepen. Source: TradingView
The first resistance now sits near $61,898. Above that, $68,000 to $70,000 may act as another supply zone. The stronger resistance remains near $74,730.
On the downside, traders are watching $56,000 to $55,000. If that area fails, Bitcoin could test $52,000 to $50,000. For now, BTC remains weak below $60,000 and $61,898.
The post BTC Losing Historic $60K Support Could Spark $1.2B Shock Before Bull Run appeared first on Live Bitcoin News.


You May Also Like

Iran Confirms Ongoing Talks With US, Says No Nuclear Commitments Made
![[Mind the Gap] Bait and switch: Upending Fil-Am lives midstream](https://www.rappler.com/tachyon/2025/12/denaturalization-when-citizenship-no-longer-feels-permanent-December-25-2025.jpg?resize=75%2C75&crop_strategy=attention)
[Mind the Gap] Bait and switch: Upending Fil-Am lives midstream

Chris Hayes says vulnerable GOP senator got 'sham vote' to look independent against Trump


