

ETH/BTC Hits Historical Support Zone — Could An Ethereum Reversal Be Next?
A pseudonymous crypto analyst has revealed that the Ethereum-to-Bitcoin pair has fallen back down to a price region that once preceded the bullish run seen in Ethereum’s past cycle.
ETH/BTC Structure Mirrors 2020 Chart Before Reversal
In an X post on June 6, market expert Crypflow highlights that the ETH/BTC price once formed a bottom around a strong support zone back in 2020. Interestingly, the bottoming of this Ethereum-to-Bitcoin ratio preceded a powerful rotation of bullish momentum into the Ethereum price, thereby fueling its last bull run.
Crypflow reveals that recently the pair has reached the same historical bottom, specifically around the 0.02528 mark. Notably, this fall towards the key level marks months of Ethereum underperformance relative to BTC. In this scenario, we see the ETH/BTC price being compressed at the apex of the trend’s triangle.
As such, Crypflow explains that for the past pattern to play out again, there must be a definitive breakout from this structure. If this happens, the Ethereum price could see a rapid and significant inflow of bullish momentum, as the breakout would signal that capital is being rotated back into Ethereum. The fact that the risk/reward ratio appears very enticing in the current setup makes it all the more likely that the 2020 bottoming and breakout events will recur.
Bitcoin Price At Pivotal $60,000 Support: Is A Recovery Underway?
In a separate post on X, Crypflow highlights that the Bitcoin price is currently testing one of its support zones that has previously cushioned weakness. The crypto pundit lists the $60,000 price level as this critical zone, which has served as the Bitcoin bottom seen in February.
With the zone being tested again, Crypflow suggests the bitcoin price could be in the earliest stages of recovery. However, this is only within the bounds of possibility, so far, $60,000 is not lost. If $60,000 holds, and a clear breakout is seen, the recovery effort could be said to have fully begun.
On the contrary, if the $60,000 zone fails to hold, Crypflow explains that Bitcoin could see a sharp downturn, with its next major target at $54,000. In this case, all hopes of a reversal playing out would have to rest on the integrity of the $54,000 level.
As of this writing, the Bitcoin price stands at $62,375, reflecting 2.45% growth over the past day. Ethereum shows similar price growth, currently worth $1,610, up 2.52% over the past 24 hours, according to CoinMarketCap data.


You May Also Like

Best Mobile User Retention Tools in 2026

Best Music AI Websites For Songs And Soundtracks
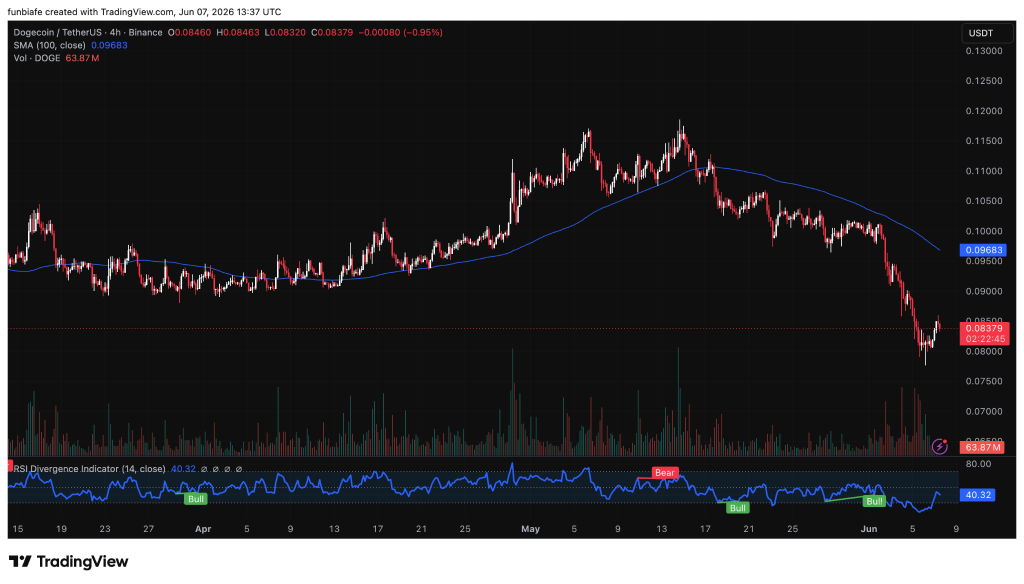
Where Could Dogecoin (DOGE) Price Go This New Week?


