

Bitcoin Options Skew Turns Defensive: Why Traders Are Paying for $52K Downside Protection
The options market is flashing caution on Bitcoin. Puts are in demand, implied volatility is higher on the downside, and flows suggest traders are willing to pay up for insurance into the $52,000 area. If you hold BTC exposure, the practical question is how to respond without overpaying or overhedging.
This article unpacks what a defensive skew means, why $52K has surfaced as a focal point, and how to structure hedges that fit your time horizon and risk budget. We’ll also outline common pitfalls so you don’t turn protection into a drag on returns.
Aspect What to Know Skew Signal Downside puts now carry richer implied volatility than calls, pointing to elevated demand for protection. Flow Snapshot June put premiums rose +46% MoM to $441.3M while call premiums fell -34% to $321.3M; call/put premium ratio flipped to 0.73 (VanEck (citing Glassnode)). Implied Vol Gap 1‑month IV for puts at 46.5% vs. 36.6% for calls, a +9.9pp differential that steepened skew (VanEck (citing Glassnode)). Open Interest Total options OI around $34.2B (‑3.4% MoM) sits in the 84th historical percentile—large notional hedges remain in place (VanEck (citing Glassnode)). Spot Level in Focus Traders have been buying puts on Deribit for expiries through late July, framed as hedges/bets on a possible drop toward ~$52K (Decrypt). Who Should Care Long-only BTC holders, miners, treasuries, and leveraged traders exposed to drawdowns or margin calls. Practical Response Budget your hedge, choose expiries aligned to catalysts, and compare protective puts vs. collars vs. spreads.
Options skew describes how implied volatility differs between puts and calls across strikes. When downside puts trade with notably higher implied volatility than comparable calls, the market is pricing greater probability or impact of a downward move—or simply showing a strong willingness to pay for insurance.
In mid-June 2026, that defensive tone was visible in multiple data points: a surge in put premiums versus calls, a widened put-call IV gap in the 1‑month bucket, and still-elevated notional exposure in open interest. None of these guarantee direction, but together they help explain why insurance costs more and why some traders are targeting protection around levels like $52K.
Skew often responds to realized volatility, liquidity, positioning, and event risk. During periods when participants fear sharp gaps or liquidation cascades, out-of-the-money puts can become relatively expensive. Conversely, a rally with strong call buying can flatten or invert skew, particularly into momentum-driven tops.
It’s important to separate the signal (risk being priced) from the action you take. You can respect a defensive skew without paying top-tier premiums; structures like collars and put spreads can cap costs while still limiting tail risk.
Key terms at a glance
- Implied Volatility (IV): The market’s forward-looking estimate of price variability embedded in option prices.
- Skew: The relative IV difference between puts and calls at similar deltas/strikes; “defensive” when puts are richer.
- Put Premium: The price paid for a put option; rises when demand for protection or implied volatility increases.
- Open Interest (OI): Total outstanding option contracts; high OI can indicate significant hedging or speculative positioning.
- Delta Hedging: Adjusting spot or futures exposure to manage directional risk from option positions.
- Collar: A protective put financed partly by selling a call, trading upside for cheaper downside cover.
Step-by-Step Playbook
- Quantify your risk window. Align hedge expiries with catalysts over the next 2–8 weeks, when skew is steep and flows are concentrated. Short-dated protection is most reactive but decays fastest.
- Set a strict hedge budget. Decide the maximum percent of notional you’ll spend per month or quarter. Elevated put IV means costs can balloon; avoid open-ended premium bleed.
- Pick a reference strike. Identify stress levels (e.g., the $52K area cited in recent flow reporting) and choose puts or spreads that meaningfully reduce P&L pain there without overpaying for deep OTM tails.
- Compare structures before you click. Price a straight protective put, a put spread, and a collar on the same expiry. Favor the one that best meets your drawdown tolerance at the lowest net premium.
- Size with deltas, not feelings. Target a specific net downside delta or VaR reduction for your book. If you’re long 1 BTC, the combination of options should offset a defined share of a 10–20% drawdown.
- Stagger expiries. Ladder protection across near-weekly and monthly maturities to reduce timing risk and to recycle hedges as skew and spot evolve.
- Pre-plan roll and exit. Set rules for taking off hedges if IV collapses, if spot invalidates the risk scenario, or as time value erodes to a predefined threshold.
- Monitor the skew, not just price. Track the put-call IV differential and call/put premium ratios; a sharp normalization can signal reduced urgency to keep heavy hedges.
Why $52K Is in Focus, and How to Size Hedges
Recent flow coverage highlighted active buying of short-dated puts on Deribit with expiries from late June through July, framed as protection against a drop toward the $52,000 area (Decrypt). That level likely reflects a confluence of technical and positioning considerations rather than a single hard catalyst. When traders cluster around a price zone, liquidity, liquidations, and optionality can amplify moves if spot accelerates in that direction.
Hedge sizing should start with two numbers: your drawdown tolerance and the probability you assign to the stress path. If you want to cap a 15% slide to single-digit losses over the next month, a 0.30–0.50 delta put (or a spread centered around the stress level) typically provides meaningful relief while keeping premiums reasonable. In a high-skew regime, collars or put spreads often beat pure puts on cost efficiency.
Because skew is steep, each incremental point of downside IV you pay matters. A practical approach is to set a budget per BTC—for instance, a small fixed percentage of notional—to avoid chasing premium. If spot drifts and skew cools, you can add or roll at lower IV rather than paying peak fear pricing.
Downside Structures Side-by-Side
Different hedges solve different problems: maximizing certainty of a floor, minimizing premium spend, or keeping upside open. Use the table below to triangulate the best fit for your constraints.
Strategy Net Cost Protection Profile Collateral/Margin Theta/PnL Drag Best Use Case Protective Put Highest (premium outlay) Floor below strike; unlimited upside Premium only High if IV elevated Simple insurance when skew not extreme Put Spread Moderate Defined floor between strikes Premium net of sold leg Medium; cheaper than pure put Cost control with acceptable floor Collar (Put + Short Call) Low to Zero (can be near-costless) Downside floor; capped upside May require margin for short call Low to Medium Hedgers willing to trade upside for protection Short Futures/Perps Funding/Carry costs Linear downside hedge; no convexity Margin intensive; liquidation risk N/A (not options) Quick delta hedge; less ideal for tails
Reading Expiries and Skew Shifts
Skew is not static. In mid-June, 1‑month downside IV outpaced calls by nearly 10 percentage points and short-dated put buying was concentrated into late-June through July expiries (VanEck (citing Glassnode); Decrypt). As these maturities roll off, two things often happen:
- Dealers rebalance hedges, which can dampen or accentuate spot moves depending on the sign and size of gamma exposure.
- Fresh protection demand can reappear one or two expiries out, especially if the underlying narrative (macro, liquidity, positioning) remains unresolved.
Keep an eye on total options open interest and its distribution by strike and expiry. With OI still high by historical standards—around $34.2B and in the 84th percentile as of mid-June (VanEck (citing Glassnode))—hedging flows can have outsized effects around key dates. If skew flattens while OI remains large, it could indicate hedges are being monetized or rotated rather than abandoned.
From a tactical standpoint, traders may step down the strike ladder (e.g., rolling $58K → $54K → $52K) as spot weakens or as time decay cheapens lower strikes. Conversely, if spot stabilizes and realized vol compresses, the skew can soften quickly—creating an opportunity to switch from spread-based hedges to cleaner puts at improved prices.
Pitfalls & Red Flags
- Paying peak IV. Buying puts exactly when the skew is steepest locks in high premiums. Consider spreads or collars until IV normalizes.
- Ignoring liquidity around expiries. Gaps and slippage can worsen fills near major Friday or month-end maturities, especially if many strikes cluster.
- Collateral and counterparty risk. Offshore venues can carry jurisdictional and operational risk. Use robust custody and risk checks; diversify venues when feasible.
- Unhedged short calls in collars. If BTC rallies hard, short calls can cap upside earlier than expected or trigger margin needs.
- Letting theta bleed unchecked. If your thesis changes or spot invalidates the risk path, trim or roll rather than allowing costly options to decay to zero.
- Over-hedging the book. Too much protection can neuter returns or even invert your exposure. Size to your actual risk, not the headline fear.
If you want ongoing coverage of derivatives flows, on-chain context, and market structure, visit Crypto Daily for daily analysis and explainers.
Frequently Asked Questions
What does a defensive Bitcoin options skew actually mean?
It means downside puts carry higher implied volatility than comparable calls, reflecting elevated demand for protection or perceived downside risk. It’s a pricing signal—not a guarantee of direction—but it tells you insurance costs more for the downside than the upside.
Why is $52,000 being discussed as a target for protection?
Recent flow coverage pointed to active buying of puts stretching from late June through July, framed around potential stress toward the $52K area on Deribit (Decrypt). It’s a reference zone informed by positioning and risk management, not a guaranteed floor or destination.
How can I protect a small BTC position without overspending?
Compare a modest put spread or a zero/low-cost collar to a straight put. Spreads and collars reduce premium outlay when skew is steep while still limiting a large portion of downside.
Is a stop-loss better than buying puts?
They solve different problems. Stops can fail in gaps and increase realized volatility of your P&L. Puts cost premium but provide defined protection through gaps. Many traders combine both, sizing options to cover gap risk while using stops for day-to-day discipline.
Which expiry should I choose in a high-skew environment?
Short-dated options are most sensitive to near-term moves and catalysts but decay rapidly. If the risk window is fuzzy, ladder across weekly and monthly expiries to mitigate timing risk and roll as new information emerges.
What indicators help confirm if the skew is easing?
Watch the put-call IV differential by delta bucket (e.g., 25-delta risk reversal), the call/put premium ratio, and changes in open interest at key strikes. A narrowing IV gap alongside monetization of protective positions can signal a softer skew.
Are options the only way to hedge BTC downside?
No. Futures or perps can offset delta directly but lack convexity and introduce funding and liquidation risks. Options provide a defined floor at a known cost; the trade-off is premium and potential upside limits if you use collars.
Disclaimer: This article is provided for informational purposes only. It is not offered or intended to be used as legal, tax, investment, financial, or other advice.


You May Also Like
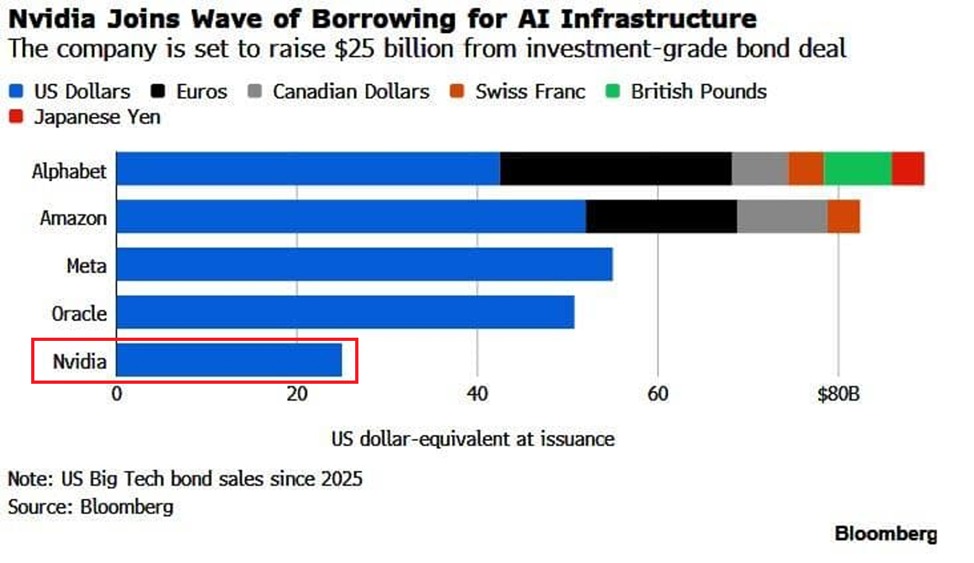
Nvidia Completes $25 Billion AI Debt Financing, Is NVDA Stock Ready for Next Rally?
Inside Trump's new weird obsession with the number 22

AI predicts XRP price for April 30, 2026


