

Intel Is Up Around 260% in 2026. With the Stock at $134, Is There Anything Left After the Apple Deal?
Key Stats for Intel Stock
- Current Price: $133.99
- Target Price (Mid): ~$300
- Street Target: ~$94
- Potential Total Return: ~125%
- Annualized IRR: ~20% / year
- Earnings Reaction: 23.60% (April 24, 2026)
Now Live: Discover how much upside your favorite stocks could have using TIKR’s new Valuation Model (It’s free) >>>
What Happened?
Intel Corporation (INTC) has become the kind of stock that splits a room. It started in 2026 near $37 and now trades at $133.99, a gain of roughly 260% that turned a left-for-dead chipmaker into one of the year’s defining comeback trades. The turnaround is no longer the debate. The price is.
That tension got sharper last week. On June 18, shares jumped 10.6% after President Trump posted that Apple had agreed to work with Intel to design and build chips in the United States. Neither company confirmed it, and Intel said only that it would not comment on a potential agreement. The stock rallied anyway, because the market now prices Intel as the default American foundry, and an Apple win would validate that thesis like nothing else.
Here is the problem for anyone buying today. Wall Street’s mean target sits at around $94, roughly 30% below the current price. The TIKR model, on its mid-case assumptions, points the other way entirely, toward around $300 by 2030. Three reference points, three answers. So, after a 260% run, is the fear rational, or is it creating one more entry?
What the Apple deal actually changes
Start with what is verifiable. Apple is not moving its flagship silicon to Intel. According to reporting on the agreement, Apple would use Intel’s 18A-P process for lower-end chips only, while Taiwan Semiconductor keeps more than 90% of its supply. The two sides had reportedly reached a preliminary agreement after more than a year of talks, so the political announcement formalized something already in motion.
What makes it credible is timing. Intel said on June 16 that 18A-P, the enhanced node built for Apple’s chips, had entered risk production, with around 9% higher performance at the same power versus base 18A. The manufacturing readiness and the customer interest are arriving in the same window, which is what a foundry turnaround needs to look like.
The deal also does not stand alone. Recent reporting has placed a Google order for more than 3 million custom AI chips at Intel Foundry for 2028, and indicated Nvidia is evaluating Intel’s 18A node. Whether any single one closes on the reported terms, the pattern is the story: Intel is being tested by the customers that matter.
 Intel NTM EV/EBITDA (TIKR)
See historical and forward estimates for Intel stock (It’s free!) >>>
The fundamentals are catching up, slowly
The bear case is not that the business is deteriorating. It is that a business still rebuilding is priced like a finished product. Intel’s LTM gross margin is 37.2%, and its EBIT margin is just 3.7%, off the floor but far from its old profile.
The trajectory is what bulls are buying. Intel has now delivered a sixth consecutive quarter of revenue above its own expectations, with Q1 2026 revenue of $13.6 billion and the Data Center and AI segment, which sells server CPUs and accelerators, up 22% year-over-year. EPS Normalized swings from negative territory to an estimated $1.09 this year and $2.27 by 2028. Free cash flow, still negative on an LTM basis, is estimated to turn positive as soon as 2026 as foundry losses narrow.
The clearest read on management’s ambition came from the Bank of America Global Technology Conference on June 2. CFO David Zinsner confirmed Intel is targeting the “Rule of 45,” meaning revenue growth plus operating margin summing to 45. “Lip-Bu’s been pretty focused on this measure,” he said, framing it as a multi-year goal. It tells you what the company is solving for: profitable growth, not growth at any cost.
More concrete was his comment on the issue that decides this stock, foundry yields. Intel is “likely going to pull in those milestones by at least a quarter, potentially even a little more” on the path to foundry-supporting margins, a timeline previously anchored to end-2027. On the next node, he was blunter: “We’re already ahead on 14A.” When a turnaround rests on manufacturing execution, management pulling timelines forward is the most important tell.
The valuation tension, in plain terms
So who is right, the Street at $94 or the model at $300? Both are internally consistent. They just assume different things.
The Street is anchored to reported results. On that basis, Intel trades at around 126x NTM earnings and 34x NTM EV/EBITDA, rich multiples for a business still posting GAAP losses. Against peers, Intel screens expensive: Nvidia trades near 21x forward earnings and Broadcom near 26x, both far more profitable today, while Micron sits near 11x. Intel’s premium only works if the earnings base it is priced against is about to change shape. The Street is not yet willing to underwrite that.
The model is. On TIKR’s mid case, around 12% revenue CAGR and a net income margin recovering toward 15% drive EPS growth of around 28% a year. Those two revenue levers, server CPU demand from the shift toward inference and agentic AI, plus external foundry customers committing volume, are exactly what Zinsner pointed to. The margin lever is factory utilization, since Intel’s heavy fixed costs mean higher volumes flow disproportionately to profit. The risk is the mirror image: if 18A and 14A yields slip, the margin recovery that justifies the valuation never arrives.
That is the fork. Upside: Intel converts its foundry pipeline into committed volume, margins inflect, and the stock works toward around $300. Downside: execution stumbles, the premium multiple compresses against thin earnings, and much of a 260% rally that was priced in perfection unwinds.
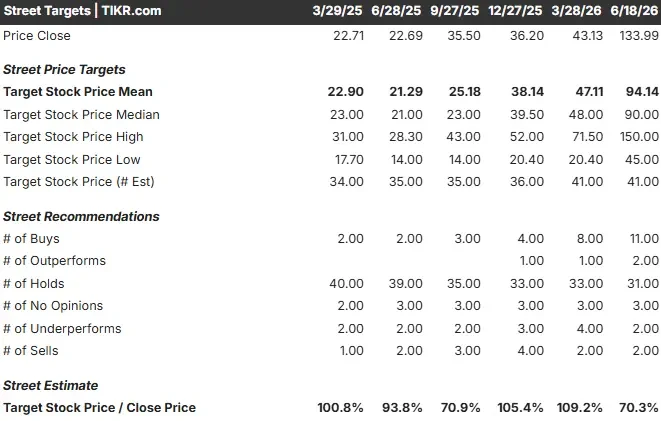 Intel Street Targets (TIKR)
See how Intel performs against its peers in TIKR (It’s free!) >>>
TIKR Advanced Model Analysis
- Current Price: $133.99
- Target Price (Mid): ~$300
- Potential Total Return: ~125%
- Annualized IRR: ~20% / year
 Intel Advanced Valuation Model (TIKR)
See analysts’ growth forecasts and price targets for Intel stock (It’s free!) >>>
This uses TIKR’s mid case: around $300 by 2030, a total return near 125%, or roughly 20% annualized over about four and a half years. The two revenue drivers are server CPU demand from the AI shift toward inference and agentic computing, and external foundry customers converting evaluation into committed volume. The margin driver is rising factory utilization, absorbing Intel’s fixed manufacturing costs. The primary risk is yield execution on 18A and 14A.
Upside: yields land on the pulled-forward timeline, and the margin assumptions prove conservative.
Downside: execution slips, the multiple compresses, and much of the rally unwinds.
Conclusion
Watch one number on July 23, when Intel reports Q2: non-GAAP gross margin. Management guided to around 39% for the year, down from Q1’s 41%. Hold at or above 39%, and the yield-and-pricing recovery is real and on schedule, which is what the $300 case needs. Slip below 37% and the timeline moves right, handing bears their argument that the stock ran ahead of the business. Everything else is narrative. That line is the scoreboard.
See what stocks billionaire investors are buying so you can follow the smart money with TIKR.
Should You Invest in Intel?
The only way to really know is to look at the numbers yourself. TIKR gives you free access to the same institutional-quality financial data that professional analysts use to answer exactly that question.
Pull up Intel, and you’ll see years of historical financials, what Wall Street analysts expect for revenue and earnings in the quarters ahead, how valuation multiples have moved over time, and whether price targets are trending up or down.
You can build a free watchlist to track Intel alongside every other stock on your radar. No credit card required. Just the data you need to decide for yourself.
Analyze Intel on TIKR Free →
Looking for New Opportunities?
- See what stocks billionaire investors are buying so you can follow the smart money.
- Analyze stocks in as little as 5 minutes with TIKR’s all-in-one, easy-to-use platform.
- The more rocks you overturn… the more opportunities you’ll uncover. Search 100K+ global stocks, global top investor holdings, and more with TIKR.
Disclaimer:
Please note that the articles on TIKR are not intended to serve as investment or financial advice from TIKR or our content team, nor are they recommendations to buy or sell any stocks. We create our content based on TIKR Terminal’s investment data and analysts’ estimates. Our analysis might not include recent company news or important updates. TIKR has no position in any stocks mentioned. Thank you for reading, and happy investing!


You May Also Like

Trump Is Furious With Senate GOP, Puts Thune In His Crosshairs

Exclusive interview with Smokey The Bera, co-founder of Berachain: How the innovative PoL public chain solves the liquidity problem and may be launched in a few months

Bitcoin Analysts Split Between Buyer Demand And Resistance Ceiling Near $65,000


