

ChatGPT Predicts Bitcoin Price if New U.S.-Iran Peace Roadmaps Succeed Within 60 Days
The Bitcoin price is hanging around $64,000 after a rough stretch for institutional money. U.S. spot Bitcoin ETFs have seen six straight weeks of net outflows. That’s kept a lid on the market, even though selling pressure has eased since earlier this month. Without fresh buying from big funds, Bitcoin has struggled to push back above $66,000.
Macro factors haven’t helped either. The U.S. Dollar Index climbed into the 100.6–100.8 range after the Fed struck a cautious tone at their June meeting. And with Treasury yields staying elevated, money keeps flowing into bonds instead of riskier plays like crypto.
However, Bitcoin hasn’t cracked below $60,000–$62,000. And that has traders asking a different question now: what if some unexpected geopolitical news gives Bitcoin the pump it needs over the next couple of months?
U.S.-Iran Talks Make Progress: What the 60-Day Roadmap Means
The United States and Iran sat down in Switzerland and came out with something real, a 60-day roadmap toward a bigger deal. Qatar and Pakistan helped broker it.
Officials say working groups are now in place to handle nuclear talks, sanctions, and disputes. They also set up a direct hotline to keep things from flaring up in the Strait of Hormuz.
On top of that, the talks produced a few economic and security measures.. Iranian Foreign Minister Abbas Araghchi stated that progress had been made on the Lebanon conflict, including temporary relief on oil and petrochemical exports, partial access to frozen assets, and plans for reconstruction efforts. Technical negotiations are expected to continue in Burgenstock throughout the coming weeks.
Further details released by Iran’s Foreign Ministry pointed to the establishment of a regional Conflict Control Unit and a new hotline mechanism for maritime security.
Tehran also said temporary permissions for oil, gas, and petrochemical exports could stay in place for 60 days. If that holds, it could take some of the geopolitical worry off the table—the kind that’s been hanging over global markets all year.
News Pushing BTC
June 18 was a rough day. In one hour, the market wiped out $180 million in leveraged long positions. It happened after the price fell below a key support level, and it showed how quickly things can unravel when there’s too much leverage in the system.
For anyone trading short-term, it was a loud reminder: volatility is still here, and risk management matters.
But at the same time, a well-known valuation model was telling a completely different story. Bitcoin’s Rainbow Chart entered its rare “Fire Sale” zone on June 21.
Previous visits to this band occurred near major cycle lows in 2015 and 2020, periods that eventually preceded substantial recoveries. Although the indicator does not predict timing, it places the BTC price in a historically attractive valuation range.
Another development came from Washington, where the SEC and CFTC opened a 60-day consultation period aimed at defining crypto perpetual futures and related derivatives. Clearer regulatory definitions could improve institutional participation and reduce uncertainty around one of crypto’s fastest-growing markets.
Bitcoin Chart Analysis
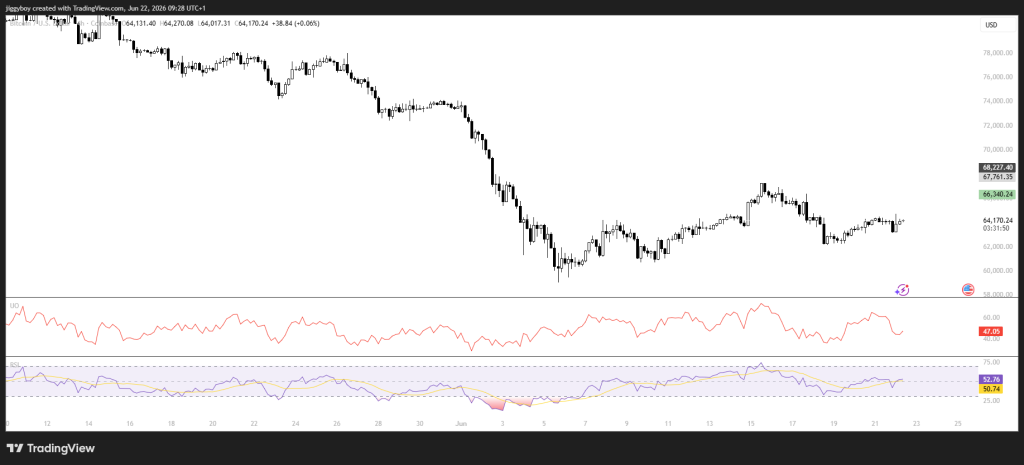
We pulled up the chart. The bigger picture is still under pressure, even though things have leveled out a bit. Bitcoin is well below that key resistance band between $67,700 and $68,200, an area that has turned it away multiple times this month.
 Source: Tradingview.com
Momentum readings are mixed. The RSI is around 52, basically neutral after climbing out of oversold territory earlier in June. That tells you sellers have backed off, but buyers haven’t taken charge yet either.
Price action shows Bitcoin holding above $62,000 after that steep drop in early June. If it can break above $66,300, that would give the bulls something to work with and open up a path to higher levels. But if it loses $62,000, then we’re probably looking at another test of lower ground.
Related Bitcoin News: Bitcoin Price News: BTC Holds Above $63K as Rare Bullish MACD Signal Hints at a Bigger Rally Ahead
ChatGPT’s Bitcoin Price Forecast if the Deal Succeeds
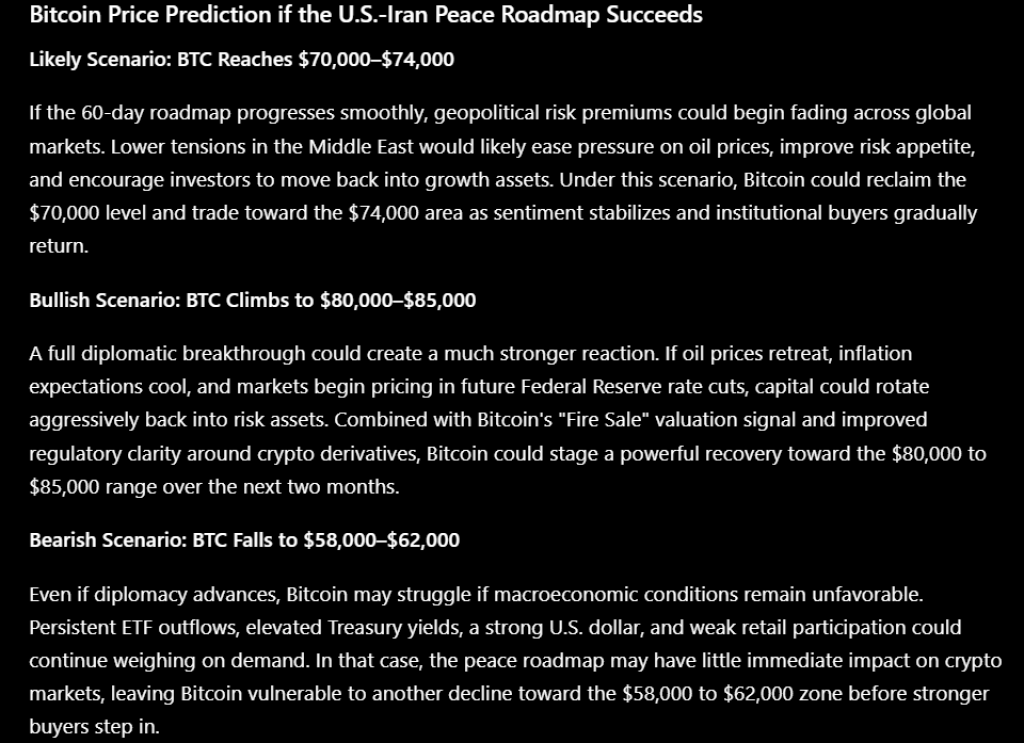
Using that roadmap and the potential for lower Middle East tensions, ChatGPT laid out three possible paths for Bitcoin over the next two months.
The base case puts the Bitcoin price between $70,000 and $74,000. If geopolitical risks ease, investor mood could brighten, energy markets could loosen up, and money could start flowing back into riskier assets.
 Source: ChatGPT
The bullish version pushes the Bitcoin price toward $80,000 to $85,000. That would probably need oil prices to drop, inflation expectations to soften, ETF demand to pick back up, and clearer rules around crypto derivatives.
The bearish case is around $58,000 to $62,000. Even if diplomacy moves forward, ongoing ETF outflows, high Treasury yields, and a strong dollar could keep a lid on things.
Final Thoughts: Is the Market Underestimating This Story?
Markets have spent much of June focusing on ETF outflows, Treasury yields, and Federal Reserve policy. The proposed U.S.-Iran roadmap introduces a different variable that could affect risk appetite across multiple asset classes.
Reduced tensions in the Middle East could ease pressure on energy prices, improve market confidence, and remove part of the geopolitical premium embedded in global assets.
That alone will not determine Bitcoin’s next move. ETF flows, macroeconomic data, and regulatory developments remain critical drivers. Yet with the Bitcoin price trading near the $64,000 price level and valuation models entering historically attractive territory, traders may be paying less attention than they should to a diplomatic development that has the potential to influence markets well beyond the Middle East.
Frequently Asked Questions

There is no official figure for Iran’s Bitcoin holdings because the government does not publicly disclose its reserves. Estimates from industry analysts put Iran’s cumulative mined Bitcoin between roughly 60,000 and 200,000 BTC, though the exact amount still held by the state remains unknown.
Bitcoin is trading near $63,000 as investors weigh improving geopolitical sentiment, institutional buying activity, and continued pressure from spot ETF outflows. Markets are also watching upcoming U.S. economic data and Federal Reserve policy signals, which remain major drivers of crypto prices.
A move to $200,000 is possible but remains an optimistic scenario rather than the consensus forecast among analysts. Most projections point to strong upside potential through 2026, though many expect Bitcoin to finish the year below the $200,000 mark.
Subscribe to our YouTube channel for daily crypto updates, market insights, and expert analysis.
The post ChatGPT Predicts Bitcoin Price if New U.S.-Iran Peace Roadmaps Succeed Within 60 Days appeared first on CaptainAltcoin.


You May Also Like

Japan’s Yen Crisis Deepens After $73 Billion Currency Intervention

Polymarket Paid Creators To Film Fake Trades In Covert Social Media Campaign, Investigation Finds

Current price of oil as of June 22, 2026


