

Solana Price Today: SOL Trapped at $74 as Extreme Fear Meets DeFi Surge
Trading at $74.10 on June 22, 2026, Solana finds itself parked almost exactly on the daily pivot level — a price point that seems unremarkable until you notice the EMA20 sitting just beneath it, the EMA50 hovering above, and a market backdrop drenched in Extreme Fear. This is not a coin drifting aimlessly. The Solana price today reflects a tense tug-of-war, and the next few sessions will likely determine which side blinks first.
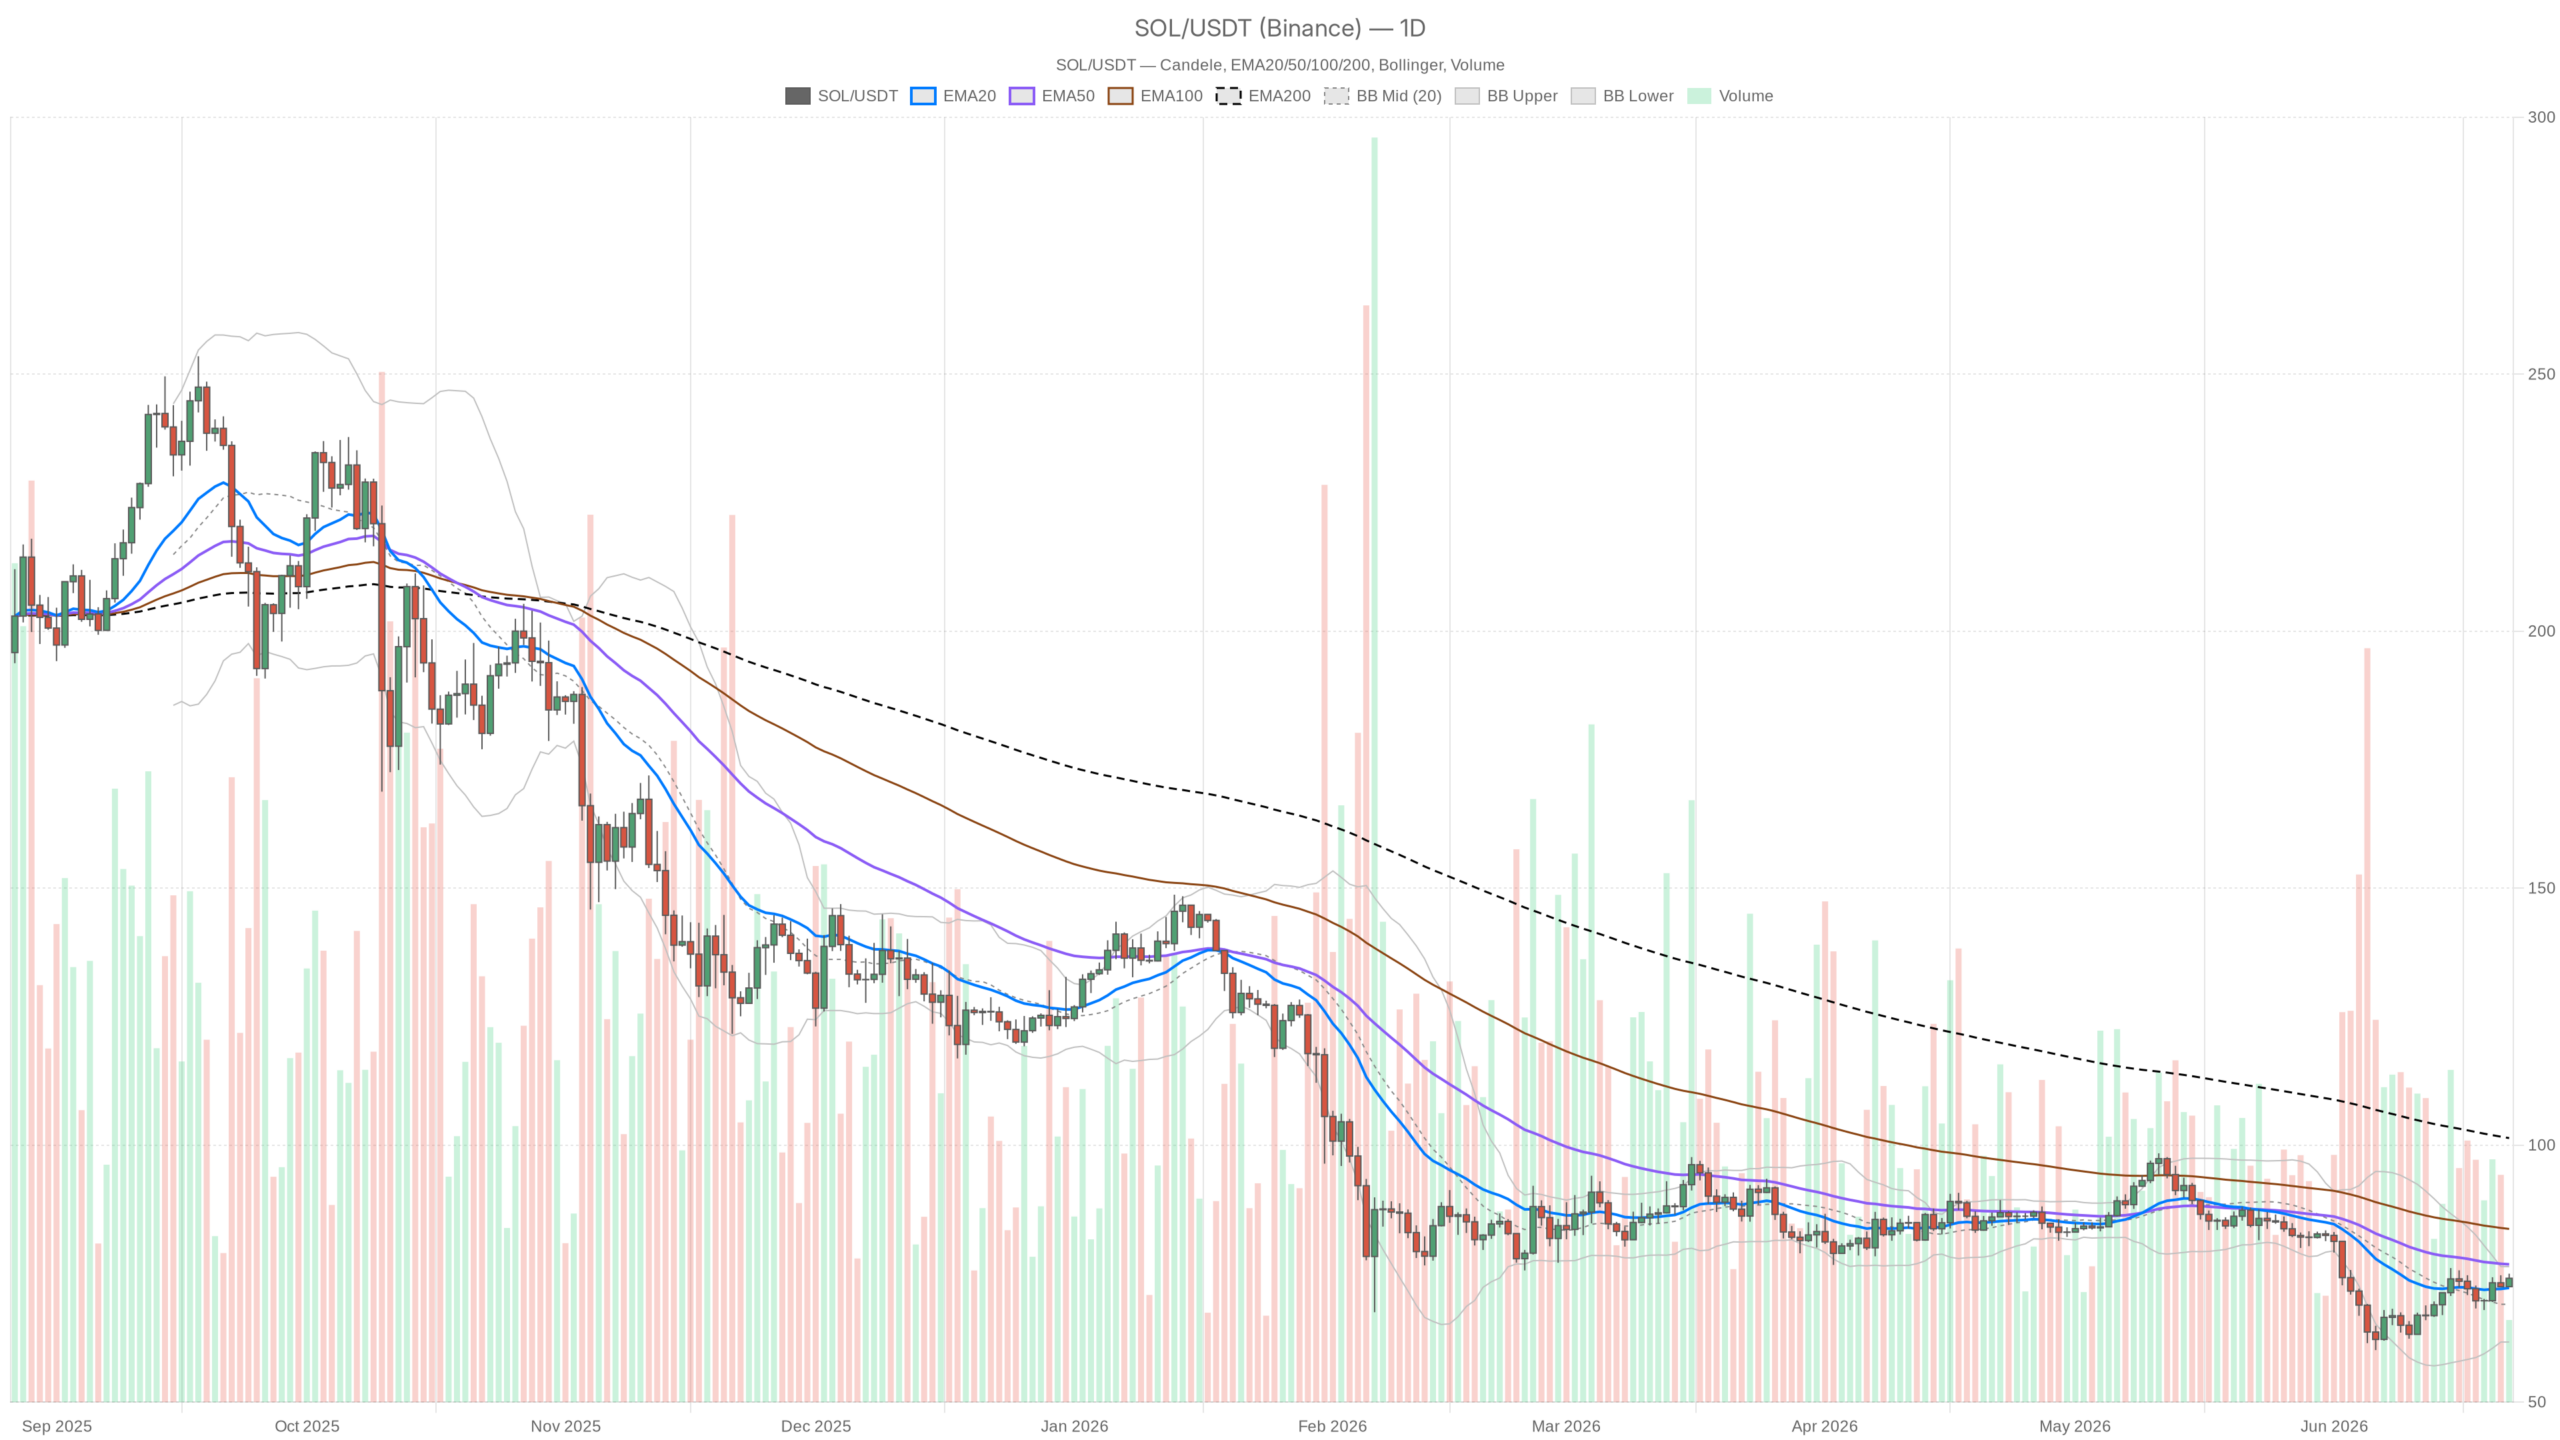 SOL/USDT — daily chart with candlesticks, EMA20/EMA50 and volume.
Key takeaways
- SOL trades at $74.10, sitting above the daily EMA20 ($72.23) but below the EMA50 ($76.81), keeping the daily regime neutral.
- The daily MACD histogram has turned positive (1.19), signaling an early-stage bullish divergence even though the MACD line remains negative.
- Raydium’s 7-day fees surged 166.6%, suggesting Solana’s DeFi ecosystem is warming up ahead of potential price momentum.
- The Fear & Greed Index sits at 20 (Extreme Fear), creating a cautious macro backdrop that limits risk appetite for altcoins.
- The $72.23–$76.81 band is the critical zone; a break in either direction will define SOL’s trajectory over the coming 48–72 hours.
The Daily Picture: Structural Damage, Tactical Recovery
The D1 regime is flagged as neutral, and that is the honest read. SOL spent considerable time below the EMA20 and is now reclaiming it — the daily close at $74.10 sits above the EMA20 at $72.23, which is a constructive development. However, the EMA50 at $76.81 still acts as overhead resistance, and the EMA200 at $101.38 remains so far above current price that it is almost irrelevant for short-term positioning.
The structural damage from the prior downtrend is real, and a single week of recovery does not erase it. The daily RSI at 51.61 captures this ambiguity perfectly. It is above 50 — technically in buyers’ territory — but only just. There is no momentum conviction here. The price bounced off oversold conditions and is now parked in no-man’s-land, which means the RSI itself will not give a strong directional read until something forces a break either way.
What is encouraging on the daily is the MACD histogram. The line sits at -1.57 and the signal at -2.76, so the MACD is still negative — bears have not fully surrendered the daily chart. Yet the histogram has printed 1.19 in positive territory, meaning the gap between line and signal is narrowing with momentum. This is a classic early-stage bullish divergence setup: not a buy signal yet, but a warning to short-sellers that the daily downtrend is losing steam.
Bollinger Bands on the daily tell a similar story. The midline sits at $69.03, well below current price, confirming the bounce off the lower band region has been meaningful. The upper band at $76.36 aligns almost perfectly with the EMA50 resistance cluster — that $76.36–$76.81 zone is the real test for any sustained recovery. Until SOL can close above it convincingly, the daily remains a cautious hold at best.
Daily ATR at $3.63 means each session can swing roughly $3.50 in either direction. That is meaningful volatility — enough to shake out nervous longs on any intraday dip, but also enough to produce sharp moves if a catalyst emerges. Position sizing matters here.
Hourly Structure: The Short-Term Bulls Have an Edge
Step down to the 1H chart and the picture brightens noticeably. The hourly regime is bullish, with price at $74.11 trading above the EMA20 ($73.65), EMA50 ($72.95), and EMA200 ($71.20). That is a clean bullish stack — all three moving averages aligned in ascending order with price above all of them. On its own, this is a solid intraday setup that gives short-term bulls a clear edge.
The hourly RSI at 56.32 is mildly bullish without being overbought, leaving room to run before hitting resistance. The 1H MACD is essentially flat, however — line at 0.23, signal at 0.27, histogram at -0.03 — suggesting the most recent push is stalling slightly. It is not rolling over, but it is not accelerating either. This is precisely where the daily friction is being felt.
The 1H Bollinger Bands are notably tight: upper band at $74.78, lower at $72.80, mid at $73.79. Compression this tight on the hourly usually precedes a directional move, and the question is which way the spring uncoils. With price sitting in the upper half of the band, the bias leans toward continuation — but a failed breakout above $74.78 would quickly flip the hourly picture negative.
Hourly pivot analysis gives clear reference points: support at $73.69, resistance at $74.50. That 81-cent range is the immediate battleground. A clean hold above $73.69 on any pullback reinforces the bullish 1H structure, while a break below it starts calling the EMA stack into question.
15-Minute Execution: Momentum Intact, but Range Is Narrow
The 15-minute chart is in bullish regime territory — EMAs stacked positively (EMA20 at $73.93, EMA50 at $73.78, EMA200 at $72.82), RSI at 54.92, and MACD showing a slim positive histogram of 0.02. Everything is aligned, but the ATR of just $0.29 per 15-minute bar makes this more of a scalping environment than a trending one.
Bollinger Bands confirm the compression: a 98-cent range from $73.38 to $74.36. Breakout traders should watch $74.36 on the upside and $73.38 as the line where short-term structure breaks down. The 15M is useful context for entries but should not drive the thesis. The timeframe tension here is actually constructive: daily neutral, hourly bullish, 15-minute bullish — the lower timeframes are leading, but they need the daily to confirm.
DeFi Activity: Raydium Signals Something
One data point worth noting from DefiLlama: Raydium AMM — Solana’s flagship liquidity backbone — saw a 25.6% single-day fee increase and a staggering 166.6% jump in 7-day fees. That is not noise. When Raydium’s fee generation spikes that dramatically over a week, it usually means trading volume on Solana’s DEX ecosystem is surging, which often precedes or accompanies price momentum in SOL itself.
It is an on-chain confirmation that activity is picking up, even if price has not fully reflected it yet. Meteora DLMM also printed a 29.3% daily fee gain. The Solana DeFi ecosystem is warming up, and that matters for the broader SOL narrative.
The Bullish Scenario
SOL clears and holds $74.78 (1H upper band), reclaims $75.24 (daily R1), and then attempts the $76.36–$76.81 resistance cluster. If that zone breaks with volume, the next logical target lies in the $79–$81 area. The daily MACD histogram turning fully positive would be the technical confirmation that the daily trend has reversed. Raydium’s fee momentum continuing would support this narrative from an ecosystem angle.
This scenario requires the broader market to stabilize — even a modest BTC move into the $65k+ range would likely give SOL the lift it needs. It is invalidated if SOL fails to hold above $73.69 (1H S1) on any pullback. A daily close back below the EMA20 at $72.23 would essentially reset the recovery and return the chart to bearish territory.
The Bearish Scenario
Fear & Greed at 20 — Extreme Fear — is not a backdrop that forgives weak hands. If the 1H structure cracks below $73.69 and the daily fails to hold above $72.23, the next meaningful support is the daily S1 at $72.71 and then the Bollinger midline at $69.03. A full retest of the lower Bollinger Band at $61.70 cannot be dismissed if sentiment deteriorates further and Bitcoin dominance climbs higher, continuing to suffocate altcoin flows.
The bearish scenario is invalidated by a clean daily close above $76.81 (EMA50). That would shift the daily regime from neutral to bullish and force a significant reassessment of the short thesis.
What to Watch
SOL is at an inflection point where the outcome matters more than the odds. The intraday structure is bullish, Solana’s DeFi activity is perking up, and the daily MACD is signaling improving momentum — but the macro overhang of Extreme Fear sentiment and a neutral daily regime means this is not a low-risk environment for swinging large size in either direction. The $72.23–$76.81 band is the zone that defines everything right now. What happens inside that range over the next 48–72 hours will set the tone for whether SOL is building a base or merely bouncing in a still-broken structure. Volatility at this level of ATR creates both opportunity and risk — those trading this move should have their levels pre-defined before the daily closes, not after.
FAQ
What is Solana’s key support level right now?
The most critical support is the daily EMA20 at $72.23. Below that, the next meaningful level is the daily S1 at $72.71, followed by the Bollinger midline at $69.03. A clean hold above $72.23 is essential to keep the recovery intact.
What resistance must SOL break to turn bullish on the daily chart?
SOL needs a convincing daily close above the $76.36–$76.81 resistance cluster, which aligns with the daily upper Bollinger Band and the EMA50. Breaking that zone with volume would flip the daily regime from neutral to bullish and open a path toward the $79–$81 area.
Is the Fear & Greed Index affecting Solana’s price?
Yes. At a reading of 20 (Extreme Fear), risk appetite across the crypto market is heavily suppressed. Bitcoin dominance at 56.2% further confirms that capital is not rotating aggressively into altcoins like SOL, creating a challenging macro backdrop despite the improving technical structure.
Why is Raydium’s fee surge significant for SOL?
Raydium AMM recorded a 166.6% jump in 7-day fees, signaling a sharp increase in DEX trading volume on Solana. Historically, spikes in on-chain activity on flagship protocols like Raydium often precede or accompany price momentum in SOL, making it a valuable ecosystem-level confirmation signal.
Disclaimer: This article is for informational purposes only and does not constitute financial advice, an investment recommendation, or a solicitation to buy or sell any financial instrument or cryptocurrency. The analysis provided is not indicative of future results. Investing in crypto assets and financial markets carries a high risk of capital loss. Always do your own research (DYOR) and consult a qualified financial advisor before making any decision.
Article produced with the assistance of artificial intelligence and reviewed by the editorial team.


You May Also Like
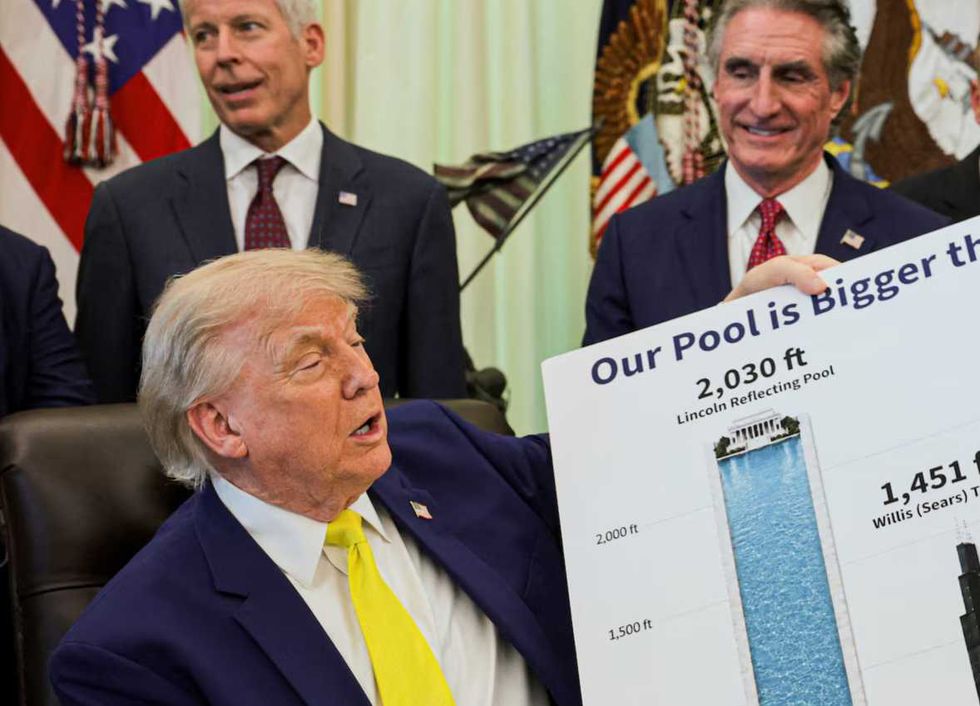
The latest smelly episode in Trump’s embarrassing Reflecting Pool saga
Mexican Peso Slides as Dollar Strengthens on Fed Repricing Ahead of Banxico Decision

CoreWeave (CRWV) Stock Surges 12% on $8.5B GPU-Backed Financing Deal — Here’s the Full Picture


Trending News
More24/7 Live News
MoreQuick Reads
More
