

Cardano (ADA) Sends Mixed Signals: Is a Breakout Brewing or Another Drop Around the Corner?
- Cardano has printed a TD Sequential buy signal.
- ADA price is currently trading at around $0.14.
Cardano (ADA) has found itself at a critical crossroads after a recent security incident involving a Cardano-based wallet protocol led to the exploitation of nearly 129 million ADA, valued at $20 million. The breach added fresh pressure to market sentiment.
Despite the setback, ADA’s daily chart has recently printed a TD Sequential buy signal, a technical indicator associated with trend exhaustion and short-term reversals. While the buy signal points to the possibility of a near-term bounce, the broader structure has yet to confirm a trend reversal.
Instead, the current setup suggests that any recovery attempt could face significant resistance overhead. The market might monitor the $0.160 to $0.176 zone, a key barrier for bullish momentum. A failure to break and hold above this range could attract renewed selling pressure and increase the likelihood of ADA extending its downtrend.
For traders, the $0.176 level may serve as the most important short-term test. A strong rejection from this area would reinforce concerns that the current rebound is merely a temporary recovery rather than the start of a sustained move higher.
Will the Bearish Setup for Cardano Continue to Deepen?
Cardano is currently trading at around $0.1474, with its daily trading volume up by over 32.53%, reaching $611.09 million. If the downtrend strengthens, the price might slip and find the crucial support at the $0.13 level. More pressure on the downside triggers the death cross to emerge, and the ADA price may drop even lower.
Assuming a bullish reversal in the Cardano market, the momentum might push the price upward, testing the resistance at around $0.15. Further correction on the upside initiates the formation of the golden cross, which the bulls would potentially push the price higher.
The Moving Average Convergence Divergence and signal lines are below the zero line, which hints that Cardano is in a bearish trend. As the negative momentum is dominating the market, the price is trading below its longer-term average.
As long as both indicators stay below zero, the overall bias remains bearish, and any moves on the upside are temporary rebounds rather than a confirmed trend reversal.
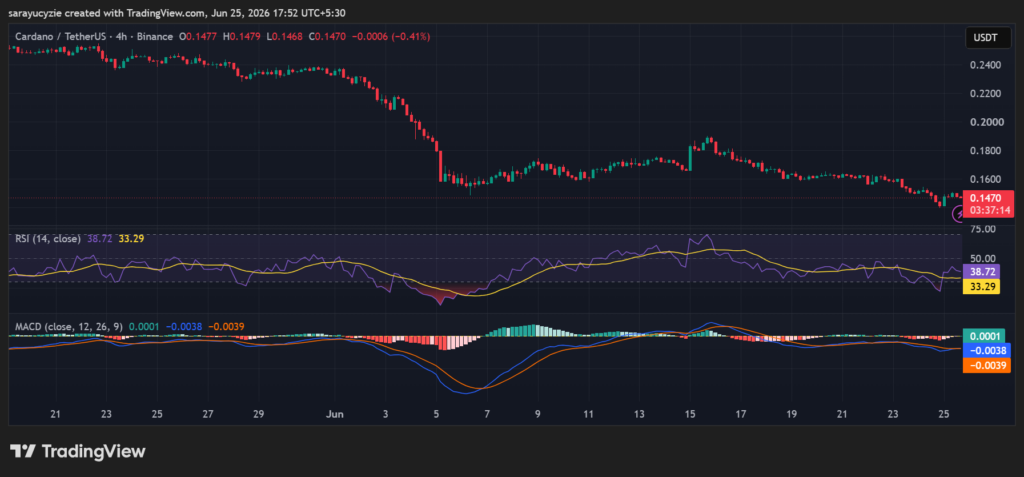 (Source: TradingView)
Cardano’s daily Relative Strength Index (RSI) at 38.72 exhibits bearish momentum, but not an oversold condition. Technically, when it remains below the 50 level, the sellers have the upper hand. It is above the 30 threshold, pointing to a market that is leaning bearish, but not yet stretched enough to signal oversold conditions.
Crypto Market Highlights
MemeCore (M) in Crisis Mode: Will the 76% Crash Trigger a Deeper Confidence Shakeout?


You May Also Like

Top U.S. economist says Gold reversal is imminent

MEV Extraction and What It Means for Price Discovery in DeFi

Xbox Hits Gamers With Price-Hike As Major Retailer Warns Console Shortage Looms Ahead Of GTA VI Launch


