TLDR Brent crude fell to ~$74 and WTI to ~$70.77, both on track for roughly 7% weekly losses Tanker traffic through the Strait of Hormuz hit its highest level sinceTLDR Brent crude fell to ~$74 and WTI to ~$70.77, both on track for roughly 7% weekly losses Tanker traffic through the Strait of Hormuz hit its highest level since

Oil Prices Fall for Third Straight Week as Hormuz Tanker Traffic Slowly Recovers

2026/06/26 16:39
3 min read
For feedback or concerns regarding this content, please contact us at crypto.news@mexc.com

TLDR

  • Brent crude fell to ~$74 and WTI to ~$70.77, both on track for roughly 7% weekly losses
  • Tanker traffic through the Strait of Hormuz hit its highest level since the Iran conflict began
  • Most of the traffic rebound is outbound vessels that were previously stranded, not new inbound tankers
  • Iran struck a commercial vessel near Hormuz, prompting the IMO to suspend its evacuation plan
  • Venezuela’s earthquakes could disrupt oil output due to power outages, adding a small bullish factor

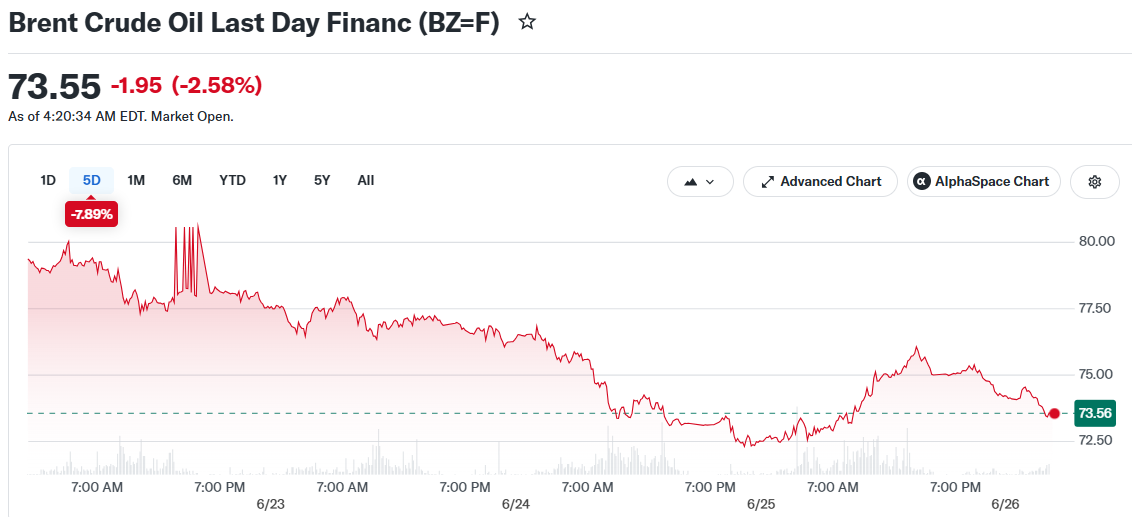
Oil prices dropped nearly 2% on Friday and were set to close out a third straight week in the red. Both Brent crude and West Texas Intermediate were tracking losses of around 7% for the week.

Brent Crude Oil Last Day Financ (BZ=F)Brent Crude Oil Last Day Financ (BZ=F)

At the time of writing, Brent was trading at around $74 per barrel. WTI was changing hands near $70.77. Oil has now erased most of its gains from the Iran conflict, having surged above $120 a barrel at the height of the crisis.

Hormuz Traffic Rebounds, But Analysts Urge Caution

The main driver of the price drop is improving tanker traffic through the Strait of Hormuz. Crude shipments through the strait climbed to their highest level since the conflict began earlier this year.

However, analysts at ING warned that the picture is not as straightforward as it looks. They pointed out that almost all of the traffic is outbound — tankers that had been stuck in the strait since March and are now leaving.

The number of tankers coming into the Persian Gulf to load fresh crude remains low. ING said that once the stranded vessels have cleared out, flows could pull back sharply.

Reuters also noted that overall vessel traffic is still a fraction of pre-war levels. Before the conflict, an average of 125 ships used the waterway each day.

Iran Strike and Peace Deal Uncertainty

A cargo ship was struck near Oman earlier in the week. US officials confirmed Iran fired on the vessel. The attack briefly pushed prices up more than 2% before the market resumed its downward trend.

The International Maritime Organization suspended its plan to help evacuate stranded ships and crews following the strike. That added fresh doubt about how durable the preliminary US-Iran peace deal really is.

That deal, reached last week, had helped reopen the strait and was the main reason oil prices started falling from their peaks above $90 a barrel earlier this month.

Venezuela Earthquakes Add Supply Risk

Devastating earthquakes hit Venezuela earlier this week. While the country’s oil infrastructure was not directly in the affected zone, power outages caused by the quakes are expected to disrupt production.

Analysts noted this as a potential supply risk, though it has not been enough to reverse the broader downward trend in prices.

The market’s attention remains firmly on the Hormuz situation and the progress of the US-Iran negotiations. Until those questions are settled, traders appear reluctant to push prices higher.

The post Oil Prices Fall for Third Straight Week as Hormuz Tanker Traffic Slowly Recovers appeared first on CoinCentral.

CHZ +28%! Will History Repeat?

CHZ +28%! Will History Repeat?CHZ +28%! Will History Repeat?

0-fee opening long & short. Be ready for any move!

Disclaimer: The articles reposted on this site are sourced from public platforms and are provided for informational purposes only. They do not necessarily reflect the views of MEXC. All rights remain with the original authors. If you believe any content infringes on third-party rights, please contact crypto.news@mexc.com for removal. MEXC makes no guarantees regarding the accuracy, completeness, or timeliness of the content and is not responsible for any actions taken based on the information provided. The content does not constitute financial, legal, or other professional advice, nor should it be considered a recommendation or endorsement by MEXC.

You May Also Like

Chams founder Demola Aladekomo retires from board after 40 years

Chams founder Demola Aladekomo retires from board after 40 years

Chams Holding Company Plc has announced the retirement of its founder, Sir (Dr.) Demola Aladekomo, from the Board…
Share
Technext2026/06/26 19:10
Ethereum koers toont zeldzaam dubbel koopsignaal en richt zich op $4.550

Ethereum koers toont zeldzaam dubbel koopsignaal en richt zich op $4.550

Connect met Like-minded Crypto Enthusiasts! Connect op Discord! Check onze Discord   Ethereum laat op de uurgrafiek twee opeenvolgende TD Sequential koopsignalen zien. Deze indicator meet uitputting in een trend en geeft vaak een signaal dat de verkoopdruk kan afnemen. Dit dubbele signaal verschijnt rond het niveau van $4.516, waar de ETH prijs kortstondig steun vindt. Dit type formatie komt zelden voor en wordt daarom extra nauwlettend gevolgd. Wat gaat de Ethereum koers hiermee doen? Ethereum koers test steun rond $4.516 De scherpe daling van de Ethereum koers vanaf de prijszone rond $4.800 bracht de ETH prijs in korte tijd naar ongeveer $4.516. Op dit niveau trad duidelijke koopactiviteit op, waardoor de neerwaartse beweging tijdelijk werd gestopt. Het dubbele signaal dat door de TD Sequential indicator is gegenereerd, viel precies samen met dit prijspunt. De TD Sequential is opgebouwd uit negen candles die een trend meetellen. Wanneer de negende candle verschijnt, kan dit duiden op een trendomslag. In dit geval verschenen zelfs twee signalen kort na elkaar, wat aangeeft dat de verkoopdruk mogelijk uitgeput is. Het feit dat dit gebeurde in een zone waar ETH kopers actief bleven, maakt het patroon extra opvallend. TD Sequential just flashed two buy signals for Ethereum $ETH! pic.twitter.com/JPO8EhiEPi — Ali (@ali_charts) September 16, 2025 Welke crypto nu kopen?Lees onze uitgebreide gids en leer welke crypto nu kopen verstandig kan zijn! Welke crypto nu kopen? Fed-voorzitter Jerome Powell heeft aangekondigd dat de rentes binnenkort zomaar eens omlaag zouden kunnen gaan, en tegelijkertijd blijft BlackRock volop crypto kopen, en dus lijkt de markt klaar om te gaan stijgen. Eén vraag komt telkens terug: welke crypto moet je nu kopen? In dit artikel bespreken we de munten die… Continue reading Ethereum koers toont zeldzaam dubbel koopsignaal en richt zich op $4.550 document.addEventListener('DOMContentLoaded', function() { var screenWidth = window.innerWidth; var excerpts = document.querySelectorAll('.lees-ook-description'); excerpts.forEach(function(description) { var excerpt = description.getAttribute('data-description'); var wordLimit = screenWidth wordLimit) { var trimmedDescription = excerpt.split(' ').slice(0, wordLimit).join(' ') + '...'; description.textContent = trimmedDescription; } }); }); Technische indicatoren schetsen herstelkans voor ETH Naast de dubbele koopsignalen verstrekken ook andere indicatoren belangrijke aanwijzingen. Tijdens de daling van de ETH koers waren grote rode candles zichtbaar, maar na de test van $4.516 stabiliseerde de Ethereum koers. Dit wijst op een mogelijke verschuiving in het evenwicht tussen de bears en bulls. Als deze opwaartse beweging doorzet, liggen de eerste weerstanden rond $4.550. Daarboven wacht een sterkere zone rond $4.650. Deze niveaus zijn in eerdere Ethereum sessies al meerdere keren getest. Een doorbraak zou ruimte openen richting de all-time high van ETH rond $4.953. Wanneer de prijs toch opnieuw onder $4.516 zakt, liggen er zones rond $4.500 en $4.450 waar grotere kooporders worden verwacht. Deze niveaus kunnen als een vangnet fungeren, mocht de druk opnieuw toenemen. Marktdynamiek bevestigt technische indicatoren De huidige situatie volgt op een bredere correctie in de cryptomarkt. Verschillende vooraanstaande crypto tokens zagen scherpe koersdalingen, waarna traders op zoek gingen naar signalen voor een mogelijke ommekeer. Dat juist Ethereum nu een dubbel TD Sequential signaal toont, versterkt de interesse in dit scenario. Fundamenteel blijft Ethereum sterk. Het aantal ETH tokens dat via staking is vastgezet, blijft groeien. Dat verkleint de vrije circulatie en vermindert verkoopdruk. Tegelijk blijft het netwerk intensief gebruikt voor DeFi, NFT’s en stablecoins. Deze activiteiten zorgen voor een stabiele vraag naar ETH, ook wanneer de prijs tijdelijk onder druk staat. Fundamentele drijfveren achter de Ethereum koers De Ethereum koers wordt echter niet alleen bepaald door candles en patronen, maar ook door bredere factoren. Een stijgend percentage van de totale ETH supply staat vast in staking contracten. Hierdoor neemt de liquiditeit op exchanges af. Dit kan prijsschommelingen versterken wanneer er plotseling meer koopdruk ontstaat. Daarnaast is Ethereum nog steeds het grootste smart contract platform. Nieuwe standaarden zoals ERC-8004 en ontwikkelingen rond layer-2 oplossingen houden de activiteit hoog. Deze technologische vooruitgang kan de waardepropositie ondersteunen en zo indirect bijdragen aan een ETH prijsherstel. Het belang van de korte termijn dynamiek De komende handelsdagen zullen duidelijk maken of de bulls genoeg kracht hebben om door de weerstandszone rond $4.550 te breken. Voor de bears ligt de focus juist op het verdedigen van de prijsregio rond $4.516. De whales, die met grote handelsorders opereren, kunnen hierin een beslissende rol spelen. Het dubbele TD Sequential signaal blijft hoe dan ook een zeldzame gebeurtenis. Voor cryptoanalisten vormt het een objectief aanknopingspunt om de kracht van de huidige Ethereum trend te toetsen. Vooruitblik op de ETH koers Ethereum liet twee opeenvolgende TD Sequential signalen zien op de uurgrafiek, iets wat zelden voorkomt. Deze formatie viel samen met steun rond $4.516, waar de bulls actief werden. Als de Ethereum koers boven dit niveau blijft, kan er ruimte ontstaan richting $4.550 en mogelijk $4.650. Zakt de prijs toch opnieuw onder $4.516, dan komen $4.500 en $4.450 in beeld als nieuwe steunzones. De combinatie van zeldzame indicatoren en een sterke fundamentele basis maakt Ethereum interessant voor zowel technische als fundamentele analyses. Of de bulls het momentum echt kunnen overnemen, zal blijken zodra de Ethereum koers de eerstvolgende weerstanden opnieuw test. Koop je crypto via Best Wallet Best wallet is een topklasse crypto wallet waarmee je anoniem crypto kan kopen. Met meer dan 60 chains gesupport kan je al je main crypto coins aanschaffen via Best Wallet. Best wallet - betrouwbare en anonieme wallet Best wallet - betrouwbare en anonieme wallet Meer dan 60 chains beschikbaar voor alle crypto Vroege toegang tot nieuwe projecten Hoge staking belongingen Lage transactiekosten Best wallet review Koop nu via Best Wallet Let op: cryptocurrency is een zeer volatiele en ongereguleerde investering. Doe je eigen onderzoek. Het bericht Ethereum koers toont zeldzaam dubbel koopsignaal en richt zich op $4.550 is geschreven door Dirk van Haaster en verscheen als eerst op Bitcoinmagazine.nl.
Share
Coinstats2025/09/17 23:31
Bangko Sentral gives banks relief on paper losses. But does this just push risk out of sight?

Bangko Sentral gives banks relief on paper losses. But does this just push risk out of sight?

Former BSP deputy governor Diwa Guinigundo warns that the temporary relief may introduce moral hazard, or the concern that banks could take on more risks if they
Share
Rappler2026/06/26 18:48

World Cup Combo: Aim for 200x

World Cup Combo: Aim for 200xWorld Cup Combo: Aim for 200x

Combine up to 20 World Cup matches in one order