

KeyBanc Sees 67% Upside for Rocket Lab Stock. The Chart Disagrees
Rocket Lab Stock is trading near $80.65, deep below its key moving averages, with RSI at one of its weakest readings in recent memory. The daily trend is unambiguously bearish. Yet new catalysts — a NASA contract award and a KeyBanc upgrade — are generating upside noise. Can fundamentals reverse a broken chart?
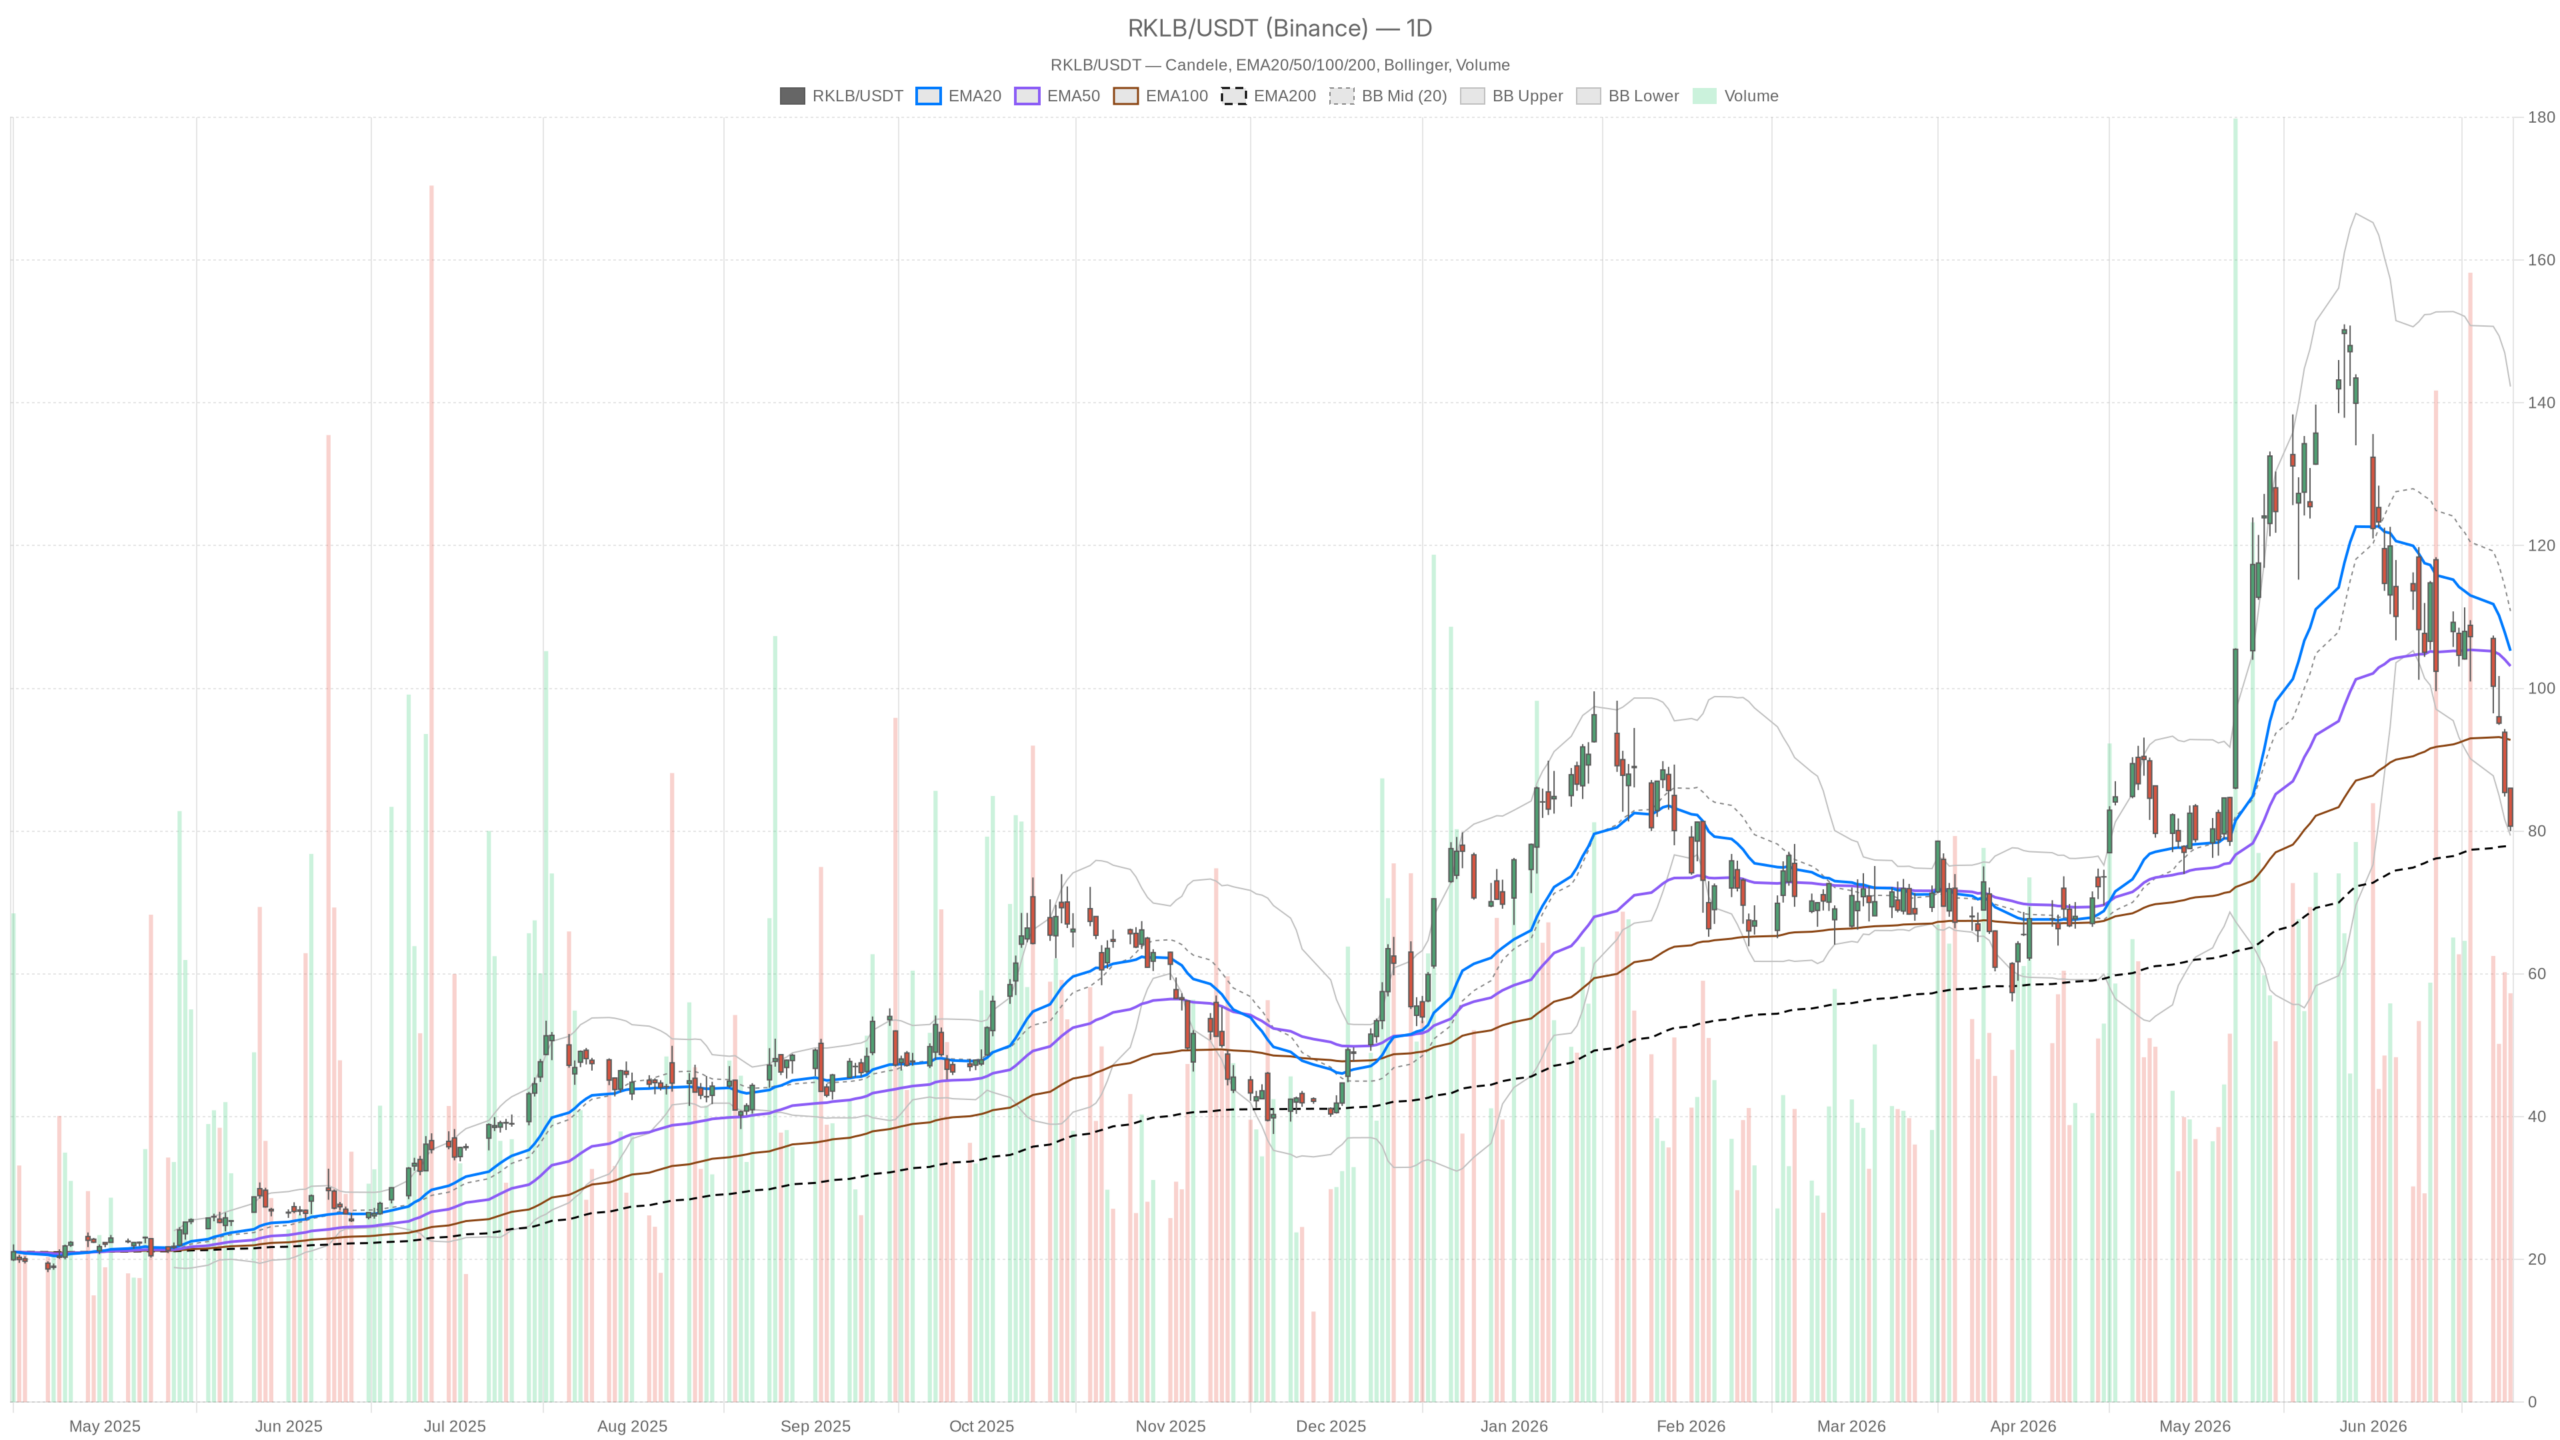 RKLB — daily chart with candlesticks, EMA20/EMA50 and volume.
Key takeaways
- RKLB closed at $80.69 on June 25, far below the EMA20 at $105.27 and EMA50 at $103.13.
- Daily RSI at 34.23 nears oversold territory, while the MACD histogram at -4.29 signals accelerating bearish momentum.
- NASA selected Rocket Lab for three Electron launches, and KeyBanc upgraded RKLB to Overweight with a $135 price target.
- A daily close below $79.38 would confirm breakdown; recovery above $84.47 is needed for any bullish shift.
- Daily ATR of $9.91 represents over 12% of price, signaling elevated volatility in both directions.
Daily Chart: Bearish Structure Dominates Rocket Lab Stock
The daily chart shows an unambiguously bearish structure for Rocket Lab Stock. Price sits far below short-term moving averages, bearish momentum is accelerating, and the stock closed below its daily pivot point.
Moving Averages and Momentum
RKLB closed at $80.69 on June 25, with the session printing a high of $86.01 and a low of $80.00. The candle was wide-ranging and closed near its lows — a bearish signal. The EMA20 at $105.27 and EMA50 at $103.13 both sit far above current price. Meanwhile, the EMA200 at $77.89 offers distant structural support below. The gap between price and short-term moving averages signals that downside momentum has been consistent for weeks.
The daily RSI at 34.23 is approaching oversold territory without quite triggering it. That level historically marks a zone where selling exhaustion begins to emerge. However, exhaustion is not the same as reversal. The MACD tells a grimmer story. The MACD line sits at -5.97, the signal line at -1.68, and the histogram is deeply negative at -4.29. That reading reflects accelerating bearish momentum, not stabilization. No cross or curl upward is visible in the data.
The Bollinger Band structure confirms the stress. Price is pressing against the lower band at $79.38, with the midline at $110.83. A close below the lower band would signal a genuine breakdown. Currently, RKLB is walking that line. Daily ATR of $9.91 confirms the stock is moving hard. With a roughly $81 price handle, that ATR represents over 12% of price in expected daily movement. Elevated volatility cuts both ways. Sharp recoveries are possible — but so are sharp extensions lower.
The daily pivot structure places resistance at $84.47 (R1) and support at $78.46 (S1), with the pivot point at $82.23. RKLB closed below that pivot. That is a technically weak close.
Lower Timeframe Analysis for Rocket Lab Stock
The hourly chart confirms every layer of the daily breakdown, while the 15-minute chart shows early signs of short-term stabilization that may offer tactical entry opportunities.
Hourly Chart: Oversold but Bearish
The 1H regime is explicitly bearish. RSI at 26.14 is firmly in oversold territory. That reading would typically invite caution about chasing short positions at these levels. However, the MACD histogram on the 1H is slightly negative at -0.23, almost flat. This marginal development suggests the rate of hourly selling is beginning to slow. The EMA structure is stacked bearishly. Price at $80.65 sits far below the EMA20 at $87.06, the EMA50 at $95.17, and the EMA200 at $106.76.
15-Minute Chart: Stabilization Emerging
The 15-minute timeframe introduces a small but notable wrinkle. The 15m MACD histogram has flipped slightly positive at +0.23. The MACD line at -0.97 is beginning to creep toward the signal at -1.21. The 15m RSI at 39.7 is recovering from lower levels. Meanwhile, Bollinger Bands on the 15m are tight. The upper band sits at $81.52 and the lower at $80.10, suggesting short-term compression. Price is consolidating near $80.65, around the 15m pivot of $80.49. This intraday dynamic hints at very short-term stabilization. It may set up a minor technical bounce. However, this should not be mistaken for a broader trend change. It is execution context only — a potential short-term entry window, not a strategic signal.
Fundamental Catalysts Challenge the Technical Breakdown
Fundamental news flow adds genuine complexity to the bearish technical picture for Rocket Lab Stock. Two significant catalysts have arrived in close succession.
NASA has selected Rocket Lab to conduct three dedicated Electron launches. These missions — PolSIR and TSIS-2 — are scheduled from Q1 2027. The contract award is a meaningful validation of RKLB’s operational capability and pipeline. It also comes ahead of an imminent launch window opening June 26. Separately, KeyBanc upgraded RKLB to Overweight with a $135 price target on June 14. The analyst cited the company’s long-term positioning within what was described as a potentially emerging new space race. That price target implies over 67% upside from current levels. Analyst upgrades of that magnitude, paired with new government contract wins, are the kind of catalysts that can interrupt technical downtrends. This is especially true when stocks are already deeply oversold.
Bullish Scenario for Rocket Lab Stock
The bullish case for Rocket Lab Stock rests on a convergence of deeply oversold conditions and fresh fundamental catalysts. Together, these could trigger a sharp recovery.
If RKLB can defend the $78.46 daily S1 support and the $77.89 EMA200, the stock may find a floor. A recovery back toward the daily pivot at $82.23, and then resistance at $84.47, would be the first indication that buying interest is returning. A sustained move above $86-$87 would begin to close the gap with the EMA20. That could attract momentum buyers. The NASA launches and analyst upgrade provide the narrative fuel for that kind of bounce. Notably, stocks in deep technical distress have reversed sharply on less.
Bearish Scenario for RKLB: Path of Least Resistance
The bearish scenario remains the path of least resistance for RKLB given the current chart structure. A breakdown below key support levels is still the dominant risk.
A daily close below $79.38 — the Bollinger lower band — would confirm a breakdown. This would likely open a test of the EMA200 at $77.89. Below that level, there is limited near-term technical structure to arrest the decline. The MACD histogram on the daily is not yet showing any sign of contraction. Until it does, the trend has not technically turned. Fundamental catalysts can delay a breakdown. However, they rarely stop one without a meaningful shift in price behavior.
Overall Outlook for Rocket Lab Stock
Rocket Lab Stock sits at an inflection point. Bearish daily structure collides with oversold extremes and fresh fundamental catalysts. This demands clarity on time horizon.
The daily bias is bearish, and the hourly regime confirms it. Yet oversold conditions across multiple timeframes and fresh fundamental catalysts are applying real upside pressure. Volatility remains extremely high — a $9.91 daily ATR means significant moves in both directions are possible on any given session. Positioning here requires clarity on time horizon. Short-term traders watching the 15-minute stabilization may see a tactical bounce opportunity with defined risk below $78.46. Longer-term investors may be tempted by the distance from analyst targets and the new contract wins. However, until the daily MACD begins to roll upward and price reclaims the $82-$84 zone with conviction, any recovery attempt should be treated as a countertrend move within a still-broken chart.
FAQ
What is the current price of Rocket Lab Stock?
RKLB closed at $80.69 on June 25, 2026, trading near $80.65 in the latest session. The stock sits far below its EMA20 at $105.27 and EMA50 at $103.13, with the EMA200 at $77.89 providing the nearest structural support.
Is Rocket Lab Stock a buy right now?
The daily chart remains bearish. While RSI at 34.23 is approaching oversold territory and fundamental catalysts are emerging, the MACD histogram at -4.29 shows accelerating bearish momentum. A recovery above $84.47 would be needed to signal a shift. Until then, any upside should be treated as a countertrend bounce.
What catalysts could push RKLB higher?
Two significant catalysts are in play. NASA selected Rocket Lab for three Electron launches — PolSIR and TSIS-2 missions — starting Q1 2027. Additionally, KeyBanc upgraded RKLB to Overweight with a $135 price target on June 14, implying over 67% upside from current levels.
What are the key support levels for Rocket Lab Stock?
The nearest support is the daily S1 at $78.46, followed by the Bollinger lower band at $79.38. Below that, the EMA200 at $77.89 represents the last major structural support. A close below $79.38 would confirm a technical breakdown.
Disclaimer: This article is for informational purposes only and does not constitute financial advice, an investment recommendation, or a solicitation to buy or sell any financial instrument or cryptocurrency. The analysis provided is not indicative of future results. Investing in crypto assets and financial markets carries a high risk of capital loss. Always do your own research (DYOR) and consult a qualified financial advisor before making any decision.
Article produced with the assistance of artificial intelligence and reviewed by the editorial team.


You May Also Like

ETH Enters High-Stakes Decision Zone

What is On-Demand Liquidity? How Ripple uses XRP to move money

Goldman Sachs’ 1 Delta Desk Warns AI’s Greatest Threat Is the Reflexive Loop


