The market has priced Pinterest stock like its growth is over. Q1’s 18% revenue beat and a $4 billion AWS bet say otherwise.The market has priced Pinterest stock like its growth is over. Q1’s 18% revenue beat and a $4 billion AWS bet say otherwise.

Why Pinterest Stock at $19 Looks Cheap in 2026

2026/06/26 15:47
6 min read
For feedback or concerns regarding this content, please contact us at crypto.news@mexc.com

Key Takeaways for Pinterest Stock as of June 2026

  • Analysts rate Pinterest stock 17 Buy, 2 Outperform, 19 Hold, and 1 Underperform, with a street mean target of $28, implying around 47% upside from the current price of $19.
  • TIKR’s mid-case model values Pinterest at $43 by December 2030, implying around 122% total return from current levels, or roughly 19% annualized over 4.5 years.
  • Pinterest committed $4 billion to Amazon Web Services through 2031, its largest-ever infrastructure deal, to power the AI models behind 80 billion monthly searches where roughly half of all search activity is commercial.

Pinterest stock trades at $19 against a $43 TIKR target. See the full valuation model on TIKR for free →

Pinterest Seals $4 Billion AWS Deal After Delivering an 18% Revenue Quarter

Pinterest, Inc. (PINS) committed $4 billion to Amazon Web Services through 2031 on June 4, 2026, its largest-ever infrastructure deal, one month after Q1 revenue of $1.008 billion beat analyst estimates by around 4%.

The platform serves 631 million logged-in monthly active users at an all-time high, who use AI-powered visual search and a proprietary taste graph, trained on hundreds of billions of user interactions, to discover products and take real-world action.

pinterest stock q1 2026PINS Stock Q1 2026 Earnings in USD (TIKR)

Q1 revenue rose 18% year-over-year to $1.008 billion, above the $968 million consensus, while adjusted EBITDA of $207 million surpassed the $176 million estimate and expanded the EBITDA margin to 20.5%, as Europe grew 27% and Rest of World grew 59% year-over-year.

Pinterest guided Q2 revenue to $1.133 billion to $1.153 billion, implying 14% to 16% year-over-year growth, above the $1.11 billion analyst consensus.

The AWS deal brings Amazon’s Graviton and Trainium chips to Pinterest’s AI infrastructure, accelerating PinRec, the proprietary generative retrieval system that improved search fulfillment and reduced advertiser CPA and CPC by approximately 180 basis points each in Q1.

Chief Technology Officer Matt Madrigal said in Q1 earnings call: “This expanded commitment with AWS gives us the compute flexibility, hardware optionality, and infrastructure efficiency to accelerate our AI vision.”

Pinterest also completed $2 billion in share repurchases through Q1, buying 109 million shares at approximately $18 and reducing shares outstanding by around 16%, with activist investor Elliott’s $1 billion equity stake backing a newly authorized $3.5 billion repurchase program carrying $2 billion still available.

Following the Q1 beat, Zephirin Group upgraded Pinterest stock from sell to buy and raised its target to $30 from $17, the most dramatic analyst rating action on the stock in the post-earnings period.

Pinterest committed $4 billion to AWS to power its AI platform. Track how the compute investment shows up in Q2 revenue on TIKR for free →

Wall Street’s $28 Mean Target on Pinterest Stock After Q1’s Earnings Beat

pinterest stock street analysts targetStreet Analysts Target for PINS Stock (TIKR)

As of June 25, 2026, 35 analysts cover Pinterest stock, rating it 17 Buy, 2 Outperform, 19 Hold, and 1 Underperform, with a street mean target of $28 and a street high of $42, implying around 47% and around 121% upside from the current price of $19, respectively.

The buy count fell from 26 in December to 17 today as the stock dropped from $26 to $18 in Q1, with the mean target compressing from $37 to $28 over the same period.

Zephirin Group’s post-Q1 upgrade from sell to buy, with a target raise to $30 from $17, marks the most visible shift in the other direction, and the 19 holds in the current distribution represent the pool of potential upgrades that a sustained mid-teens revenue trajectory would convert.

Can Pinterest Stock’s AI Advertising Platform Deliver 15% Revenue Growth in 2026?

pinterest stock revenue actuals & estimatesPINS Stock Revenue Actuals & Estimates (TIKR)

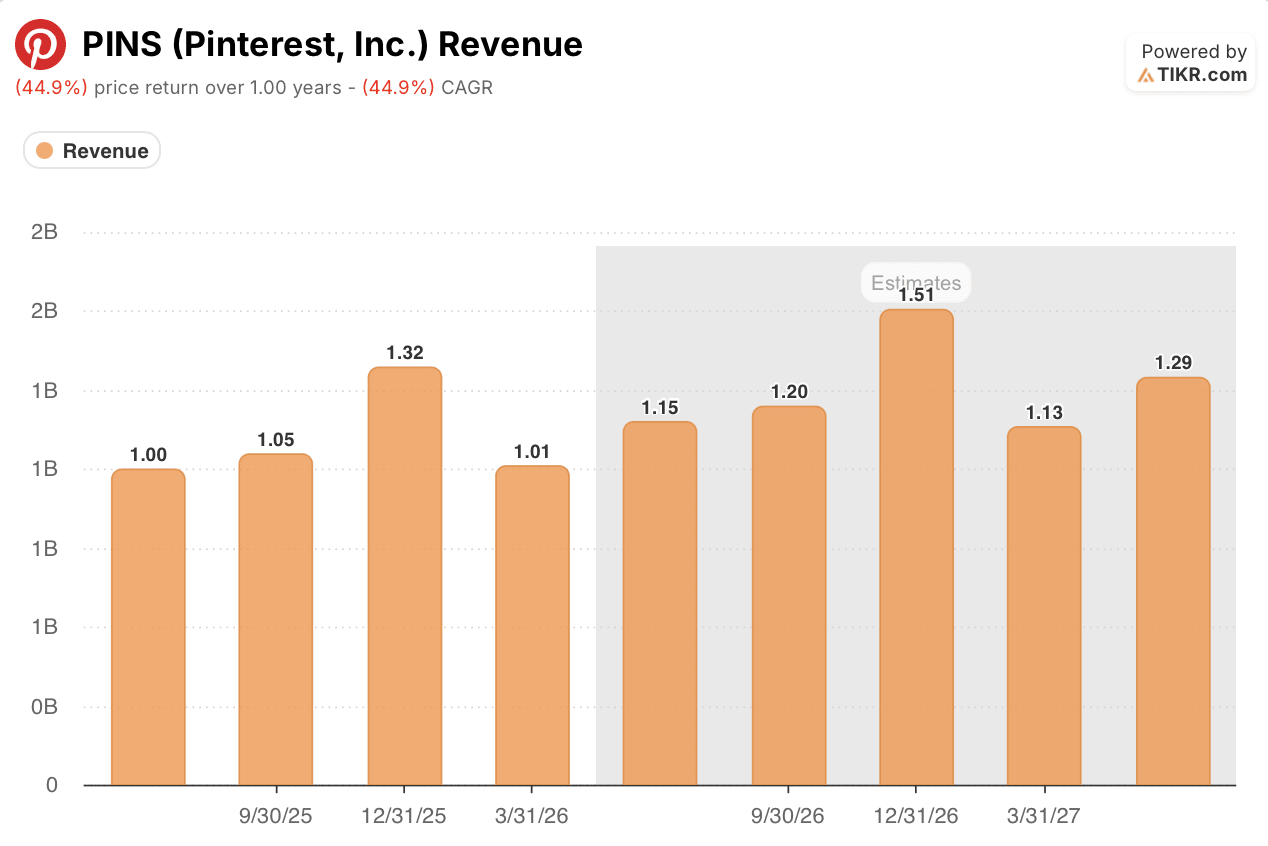
Wall Street expects Pinterest stock’s revenue to reach around $1.15 billion in Q2 2026, growing around 15% year-over-year, an expectation built on Performance+ adoption continuing to expand beyond the current 30% of lower-funnel revenue and SMB spend growth offsetting ongoing caution from the platform’s largest retail advertisers.

The consensus projects Q3 2026 revenue at around $1.20 billion (around 14% growth) and Q4 2026 at around $1.51 billion (around 14% growth), a mid-teens baseline that reflects the Street’s view that Pinterest’s AI-driven monetization transition is on track but has yet to fully close the gap between the platform’s engagement strength and its ad revenue capture rate.

The Q2 revenue print, targeted at $1.133 billion to $1.153 billion, will determine whether Q1’s AI platform gains translate into a durable mid-teens trajectory, and if Pinterest delivers the high end while EBITDA margins hold near 24%, the 19 holds in the current coverage distribution find their conversion trigger before Q3.

Is Pinterest Stock Undervalued in 2026? TIKR’s $43 Mid-Case Says Yes

TIKR’s mid-case model values Pinterest at around $43 by December 2030, implying around 122% total return from the current price of $19, or roughly 19% annualized over 4.5 years.

pinterest stock valuation model resultsPINS Stock Valuation Model Results (TIKR)

The roughly 19% annualized return positions Pinterest stock as one of the higher-return opportunities across large-cap social media, where mature platforms trade at premium multiples while delivering mid-single-digit annual returns, and the gap between $19 and $43 reflects a market pricing Pinterest stock as a stalled advertising platform rather than an undermonetized one with a working AI engine.

The $43 target requires no heroic revenue assumptions, resting on a platform where 631 million logged-in MAUs are at a record high, a Q1 beat confirmed the AI ad engine generates measurable returns for advertisers, a $4 billion AWS infrastructure commitment secures the compute capacity to extend those gains across a larger advertiser base, and a $3.5 billion buyback program signals management’s conviction that $19 substantially undervalues the business.

TIKR’s mid-case values Pinterest at $43 by December 2030, implying around 122% total return. Build your own model on TIKR for free →

Should You Invest in Pinterest, Inc.?

The only way to really know is to look at the numbers yourself. TIKR gives you free access to the same institutional-quality financial data that professional analysts use to answer exactly that question.

Pull up Pinterest, Inc. stock and you’ll see years of historical financials, what Wall Street analysts expect for revenue and earnings in the quarters ahead, how valuation multiples have moved over time, and whether price targets are trending up or down.

You can build a free watchlist to track Pinterest, Inc. alongside every other stock on your radar. No credit card required. Just the data you need to decide for yourself.

Access Professional Tools to Analyze PINS stock on TIKR for Free →

Market Opportunity
4 Logo
4 Price(4)
$0.008996
$0.008996$0.008996
-1.89%
USD
4 (4) Live Price Chart

CHZ +28%! Will History Repeat?

CHZ +28%! Will History Repeat?CHZ +28%! Will History Repeat?

0-fee opening long & short. Be ready for any move!

Disclaimer: The articles reposted on this site are sourced from public platforms and are provided for informational purposes only. They do not necessarily reflect the views of MEXC. All rights remain with the original authors. If you believe any content infringes on third-party rights, please contact crypto.news@mexc.com for removal. MEXC makes no guarantees regarding the accuracy, completeness, or timeliness of the content and is not responsible for any actions taken based on the information provided. The content does not constitute financial, legal, or other professional advice, nor should it be considered a recommendation or endorsement by MEXC.

You May Also Like

XRP fell below the key $1.09 support, analyst says further decline to $0.87–$0.90 possible before next rally

XRP fell below the key $1.09 support, analyst says further decline to $0.87–$0.90 possible before next rally

🚨 $XRP fell below the critical $1.09 support level, signaling more downside risk. 📉 Analyst Diana expects further declines toward $0.87–$0.90 before any recovery
Share
COINTURK EN2026/06/26 19:31
Chams founder Demola Aladekomo retires from board after 40 years

Chams founder Demola Aladekomo retires from board after 40 years

Chams Holding Company Plc has announced the retirement of its founder, Sir (Dr.) Demola Aladekomo, from the Board…
Share
Technext2026/06/26 19:10
Ethereum koers toont zeldzaam dubbel koopsignaal en richt zich op $4.550

Ethereum koers toont zeldzaam dubbel koopsignaal en richt zich op $4.550

Connect met Like-minded Crypto Enthusiasts! Connect op Discord! Check onze Discord   Ethereum laat op de uurgrafiek twee opeenvolgende TD Sequential koopsignalen zien. Deze indicator meet uitputting in een trend en geeft vaak een signaal dat de verkoopdruk kan afnemen. Dit dubbele signaal verschijnt rond het niveau van $4.516, waar de ETH prijs kortstondig steun vindt. Dit type formatie komt zelden voor en wordt daarom extra nauwlettend gevolgd. Wat gaat de Ethereum koers hiermee doen? Ethereum koers test steun rond $4.516 De scherpe daling van de Ethereum koers vanaf de prijszone rond $4.800 bracht de ETH prijs in korte tijd naar ongeveer $4.516. Op dit niveau trad duidelijke koopactiviteit op, waardoor de neerwaartse beweging tijdelijk werd gestopt. Het dubbele signaal dat door de TD Sequential indicator is gegenereerd, viel precies samen met dit prijspunt. De TD Sequential is opgebouwd uit negen candles die een trend meetellen. Wanneer de negende candle verschijnt, kan dit duiden op een trendomslag. In dit geval verschenen zelfs twee signalen kort na elkaar, wat aangeeft dat de verkoopdruk mogelijk uitgeput is. Het feit dat dit gebeurde in een zone waar ETH kopers actief bleven, maakt het patroon extra opvallend. TD Sequential just flashed two buy signals for Ethereum $ETH! pic.twitter.com/JPO8EhiEPi — Ali (@ali_charts) September 16, 2025 Welke crypto nu kopen?Lees onze uitgebreide gids en leer welke crypto nu kopen verstandig kan zijn! Welke crypto nu kopen? Fed-voorzitter Jerome Powell heeft aangekondigd dat de rentes binnenkort zomaar eens omlaag zouden kunnen gaan, en tegelijkertijd blijft BlackRock volop crypto kopen, en dus lijkt de markt klaar om te gaan stijgen. Eén vraag komt telkens terug: welke crypto moet je nu kopen? In dit artikel bespreken we de munten die… Continue reading Ethereum koers toont zeldzaam dubbel koopsignaal en richt zich op $4.550 document.addEventListener('DOMContentLoaded', function() { var screenWidth = window.innerWidth; var excerpts = document.querySelectorAll('.lees-ook-description'); excerpts.forEach(function(description) { var excerpt = description.getAttribute('data-description'); var wordLimit = screenWidth wordLimit) { var trimmedDescription = excerpt.split(' ').slice(0, wordLimit).join(' ') + '...'; description.textContent = trimmedDescription; } }); }); Technische indicatoren schetsen herstelkans voor ETH Naast de dubbele koopsignalen verstrekken ook andere indicatoren belangrijke aanwijzingen. Tijdens de daling van de ETH koers waren grote rode candles zichtbaar, maar na de test van $4.516 stabiliseerde de Ethereum koers. Dit wijst op een mogelijke verschuiving in het evenwicht tussen de bears en bulls. Als deze opwaartse beweging doorzet, liggen de eerste weerstanden rond $4.550. Daarboven wacht een sterkere zone rond $4.650. Deze niveaus zijn in eerdere Ethereum sessies al meerdere keren getest. Een doorbraak zou ruimte openen richting de all-time high van ETH rond $4.953. Wanneer de prijs toch opnieuw onder $4.516 zakt, liggen er zones rond $4.500 en $4.450 waar grotere kooporders worden verwacht. Deze niveaus kunnen als een vangnet fungeren, mocht de druk opnieuw toenemen. Marktdynamiek bevestigt technische indicatoren De huidige situatie volgt op een bredere correctie in de cryptomarkt. Verschillende vooraanstaande crypto tokens zagen scherpe koersdalingen, waarna traders op zoek gingen naar signalen voor een mogelijke ommekeer. Dat juist Ethereum nu een dubbel TD Sequential signaal toont, versterkt de interesse in dit scenario. Fundamenteel blijft Ethereum sterk. Het aantal ETH tokens dat via staking is vastgezet, blijft groeien. Dat verkleint de vrije circulatie en vermindert verkoopdruk. Tegelijk blijft het netwerk intensief gebruikt voor DeFi, NFT’s en stablecoins. Deze activiteiten zorgen voor een stabiele vraag naar ETH, ook wanneer de prijs tijdelijk onder druk staat. Fundamentele drijfveren achter de Ethereum koers De Ethereum koers wordt echter niet alleen bepaald door candles en patronen, maar ook door bredere factoren. Een stijgend percentage van de totale ETH supply staat vast in staking contracten. Hierdoor neemt de liquiditeit op exchanges af. Dit kan prijsschommelingen versterken wanneer er plotseling meer koopdruk ontstaat. Daarnaast is Ethereum nog steeds het grootste smart contract platform. Nieuwe standaarden zoals ERC-8004 en ontwikkelingen rond layer-2 oplossingen houden de activiteit hoog. Deze technologische vooruitgang kan de waardepropositie ondersteunen en zo indirect bijdragen aan een ETH prijsherstel. Het belang van de korte termijn dynamiek De komende handelsdagen zullen duidelijk maken of de bulls genoeg kracht hebben om door de weerstandszone rond $4.550 te breken. Voor de bears ligt de focus juist op het verdedigen van de prijsregio rond $4.516. De whales, die met grote handelsorders opereren, kunnen hierin een beslissende rol spelen. Het dubbele TD Sequential signaal blijft hoe dan ook een zeldzame gebeurtenis. Voor cryptoanalisten vormt het een objectief aanknopingspunt om de kracht van de huidige Ethereum trend te toetsen. Vooruitblik op de ETH koers Ethereum liet twee opeenvolgende TD Sequential signalen zien op de uurgrafiek, iets wat zelden voorkomt. Deze formatie viel samen met steun rond $4.516, waar de bulls actief werden. Als de Ethereum koers boven dit niveau blijft, kan er ruimte ontstaan richting $4.550 en mogelijk $4.650. Zakt de prijs toch opnieuw onder $4.516, dan komen $4.500 en $4.450 in beeld als nieuwe steunzones. De combinatie van zeldzame indicatoren en een sterke fundamentele basis maakt Ethereum interessant voor zowel technische als fundamentele analyses. Of de bulls het momentum echt kunnen overnemen, zal blijken zodra de Ethereum koers de eerstvolgende weerstanden opnieuw test. Koop je crypto via Best Wallet Best wallet is een topklasse crypto wallet waarmee je anoniem crypto kan kopen. Met meer dan 60 chains gesupport kan je al je main crypto coins aanschaffen via Best Wallet. Best wallet - betrouwbare en anonieme wallet Best wallet - betrouwbare en anonieme wallet Meer dan 60 chains beschikbaar voor alle crypto Vroege toegang tot nieuwe projecten Hoge staking belongingen Lage transactiekosten Best wallet review Koop nu via Best Wallet Let op: cryptocurrency is een zeer volatiele en ongereguleerde investering. Doe je eigen onderzoek. Het bericht Ethereum koers toont zeldzaam dubbel koopsignaal en richt zich op $4.550 is geschreven door Dirk van Haaster en verscheen als eerst op Bitcoinmagazine.nl.
Share
Coinstats2025/09/17 23:31

World Cup Combo: Aim for 200x

World Cup Combo: Aim for 200xWorld Cup Combo: Aim for 200x

Combine up to 20 World Cup matches in one order