Hyperliquid (HYPE) Holds the Bullish Edge: Are Bigger Gains on the Horizon?
- Hyperliquid (HYPE) price is hovering near $69.
- The bullish crossover reflects increasing buying pressure.
Zooming in on the altcoin market, Hyperliquid (HYPE) attempts to trade on the upside, breaking bearish chains. If the bulls turned stronger, they would dictate their further trajectory. The charts exhibit the short-term fading of bearish momentum.
Also, the technical setup is flipping positive, as the asset hovers within the green zone. The bullish price structure confirms that buyers are dominating the broader market trend of HYPE.
Moreover, Hyperliquid is currently trading near the $69.25, with a 6.34% gain in value over the last 24 hours, according to CoinMarketCap data. The price is holding above the daily low noted at $65.00, and below the daily high of $69.30.
The trading pattern of the asset shows that the short-term momentum would find significant resistance at $69.57, followed by a range above $69.90. The bulls would hit a higher level, which decides HYPE’s trajectory. On the other hand, the first support level of Hyperliquid is likely found below $68. A weaker move toward the $68.50 range confirms the bearish dominance, and more downside could trigger losses.
What Does HYPE’s Technical Chart Setup Point To?
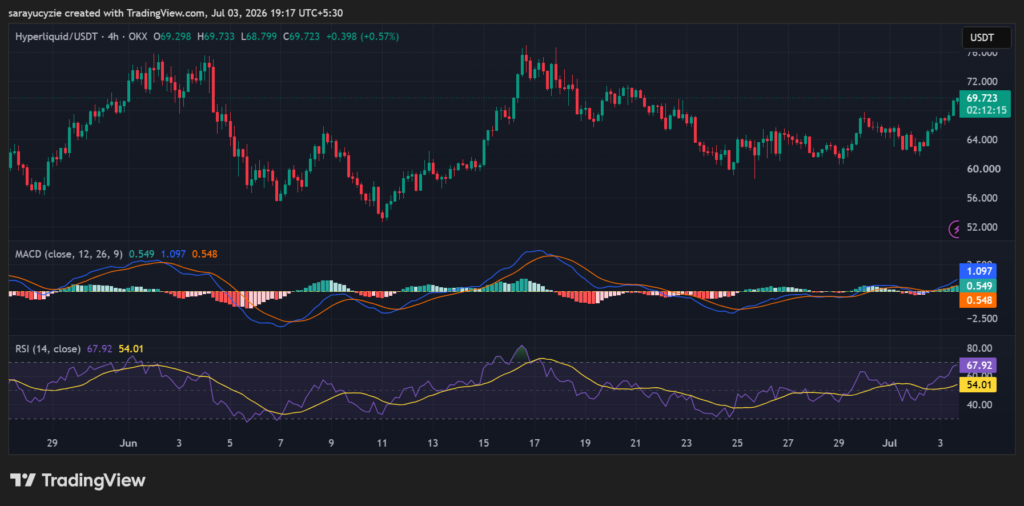
The four-hour chart shows that the Moving Average Convergence Divergence (MACD) line is above the signal line and both are above the zero line. It indicates that bullish momentum is gaining strength within a positive trend. The bullish crossover reflects increasing buying pressure.
This setup supports continued upward price movement, provided buying interest remains strong and momentum is sustained.
 (Source: TradingView)
In addition, the daily Relative Strength Index is resting at around 67.92, which hints at strong bullish momentum. The value is approaching the 70 range, the overbought zone, showing that buyers are firmly in control.
While the trend still favours further gains, the market is beginning to near an area where buying momentum could slow and profit-taking may emerge. This reading supports continued bullish price action, but traders should also watch for signs of momentum cooling if the RSI moves above 70.
Crypto Market Highlights
Bearish Clouds Gather as $2.13B in Bitcoin and Ethereum Options Expire


You May Also Like

Justice à la Carte: The ICC’s Curious New Recipe for Removing Karim Khan — Abbi Kanthasamy

Insurgents attack multiple towns in northern, central Mali