

XRP Price: Symmetrical Triangle Is Almost Done — Watch These Levels
TLDR
- XRP is trading at $1.13, down 3.21% in 24 hours, with trading volume dropping 43.3% to $1.14 billion.
- Analyst Egrag Crypto says the Super Guppy indicator has shifted into compression, signaling slowing momentum.
- The $0.80–$1.10 range is the key support zone; a breakdown could damage XRP’s overall market structure.
- Analyst ChartNerd warns XRP may form a death cross between the 20-week EMA and 200-week SMA near $1.20.
- XRP is compressing inside a symmetrical triangle, with bulls targeting a reclaim of the $2 level.
XRP is trading at $1.13 as of July 5, 2026, down 3.21% over the past 24 hours. Trading volume has dropped to $1.14 billion, a fall of 43.3%, according to CoinMarketCap data. Despite the daily dip, XRP has gained 8.75% over the past week.
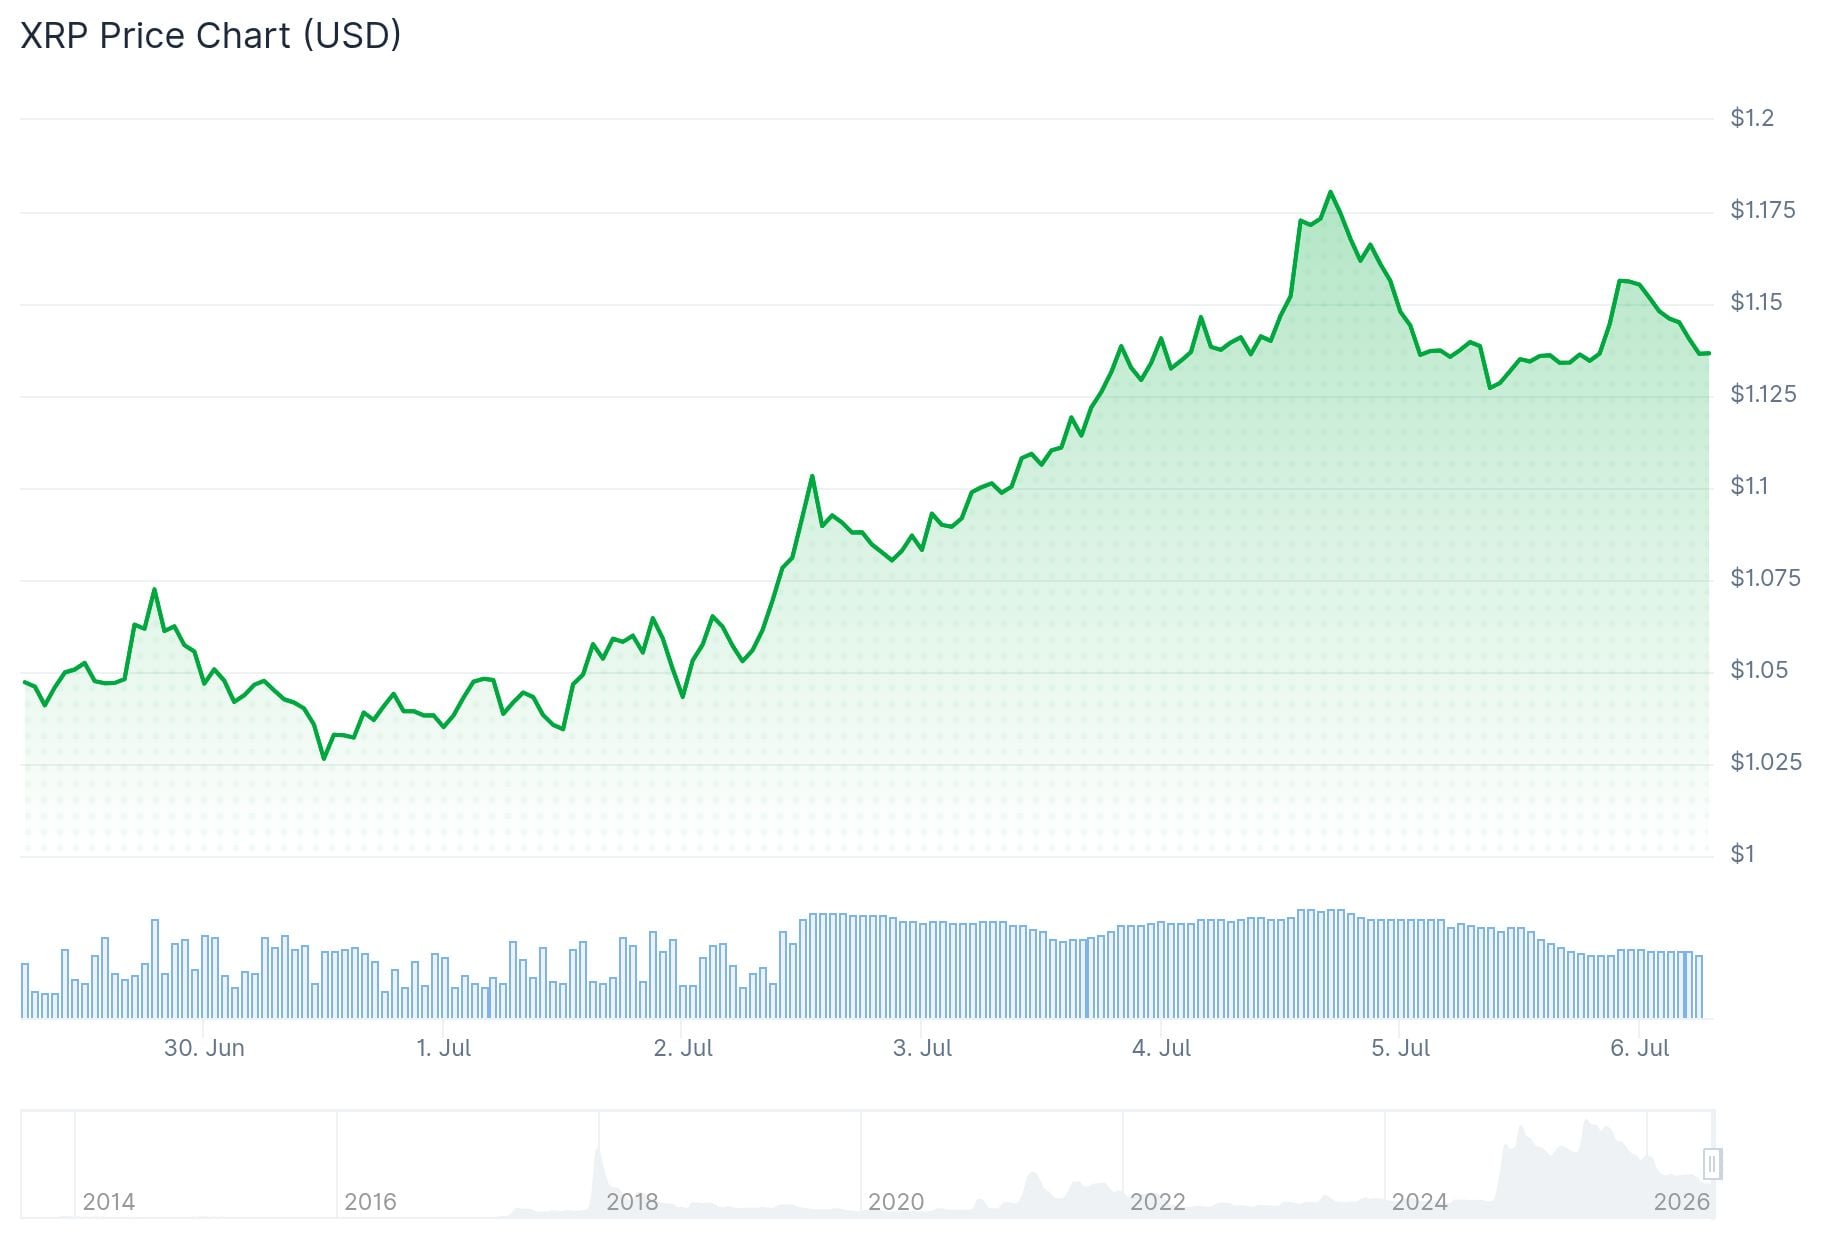 XRP Price
The price drop came as analysts flagged two key technical signals. One points to slowing momentum. The other raises the possibility of a bearish crossover on the weekly chart.
Analyst Cryptollica posted on X that XRP is sitting at its lowest oversold level in its 13-year history. They wrote: “This is not where the crowd gets excited. This is where most gives up before the real move begins.” Cryptollica pointed out that the RSI is deeper than any major XRP reset in its history, and that price is testing long-term structure — not after a euphoric breakout, but after years of rejection and disbelief.
Popular analyst Egrag Crypto highlighted the Super Guppy indicator on XRP’s weekly chart. He noted the signal has moved from strong green expansion to a mix of grey and compression colors. This shift suggests momentum is cooling down.
Egrag calls this the “macro retest” or “cooldown pattern.” He says the $0.80–$1.10 range is the key support zone to watch. As long as XRP holds within this range, the broader structure remains intact.
Super Guppy Targets and the Road Back to Green
If XRP can hold support, reclaim the red moving average area, and push the Guppy back to green, Egrag has set out several upside targets. These include $3.59, a range of $6.73–$9.17, $16.36, and a wider cycle extension target of $53.86.
Those are long-term projections. The short-term picture is more cautious.
Analyst ChartNerd warned that XRP is close to printing a death cross on the weekly chart. Specifically, the 20-week EMA could cross below the 200-week SMA. The 200-week SMA is currently near $1.20.
ChartNerd noted that similar patterns appeared during past bear cycles. In 2022, XRP hit a local low just one week after the death cross formed. In the longer 2018–2020 bear cycle, the bottom came six months later.
Based on those two historical examples, ChartNerd sees a possible cycle low between June and the end of 2026, with price targets of $0.90 or $0.70.
Symmetrical Triangle Adds Another Layer to Watch
Separately, on-chain metrics provider XRP Update has flagged a symmetrical triangle forming on XRP’s chart. Price has been compressing between a descending resistance line and an ascending support line for several months.
The triangle is now approaching its apex. This means the period of consolidation is nearly over.
A breakout above the triangle’s resistance, with strong volume behind it, would be the signal bulls are watching for.
XRP has also been showing hidden bullish divergence alongside rising RSI lows. Some analysts view this as a sign that buying pressure is quietly building beneath the surface.
The RSI divergence and triangle compression together point to a potential move toward $2. Some analysts believe momentum beyond that level could push price toward the $3 region.
As of July 5, 2026, XRP remains at $1.13, with the $1.20 level — where the 200-week SMA sits — acting as the nearest resistance level to watch.
The post XRP Price: Symmetrical Triangle Is Almost Done — Watch These Levels appeared first on CoinCentral.


You May Also Like

Dave Portnoy Vows To Ride Bitcoin To Zero After Buying At $100K
Intel (INTC) Stock Climbs to $120.35 as Institutional Buying Accelerates
Futures Rise As Tech Rebounds In Post-Holiday Catch Up



