WLFI price prints a bearish SFP after sweeping major liquidity at the swing high, signalling increased downside risk if price fails to reclaim key value area levels.WLFI price prints a bearish SFP after sweeping major liquidity at the swing high, signalling increased downside risk if price fails to reclaim key value area levels.

WLFI price rejects after liquidity grab, bearish SFP emerges

WLFI price prints a bearish SFP after sweeping major liquidity at the swing high, signalling increased downside risk if price fails to reclaim key value area levels.

Summary
  • WLFI’s recent rejection shows fading bullish strength after an aggressive liquidity sweep.
  • Current positioning below $0.16 keeps sellers in control of short-term direction.
  • A move into $0.12 would provide the next major reaction zone for traders.

World Liberty Financial (WLFI), the Trump family’s crypto firm, has delivered a sharp rejection after sweeping liquidity above its recent swing high, forming a clear bearish Swing Failure Pattern. This development follows an impulsive rally from the predetermined $0.11 support, but momentum has now shifted as sellers step in aggressively. 

Crypto tensions are climbing in Washington, with senators now demanding a probe into World Liberty Financial, adding further uncertainty around the asset’s short-term trajectory. The evolving structure places the focus on value area levels that will determine whether WLFI extends lower or manages a reclaim to regain bullish footing.

WLFI price key technical points

  • Bearish SFP confirms a failed breakout, placing pressure on WLFI as trapped longs unwind.
  • Value area high at $0.16 acts as the decisive pivot, where a breakdown signals continuation to the downside.
  • High-time-frame support at $0.12 is the next major target, marking a key reaction zone if bearish momentum persists.
WLFI price rejects after liquidity grab, bearish SFP emerges - 1

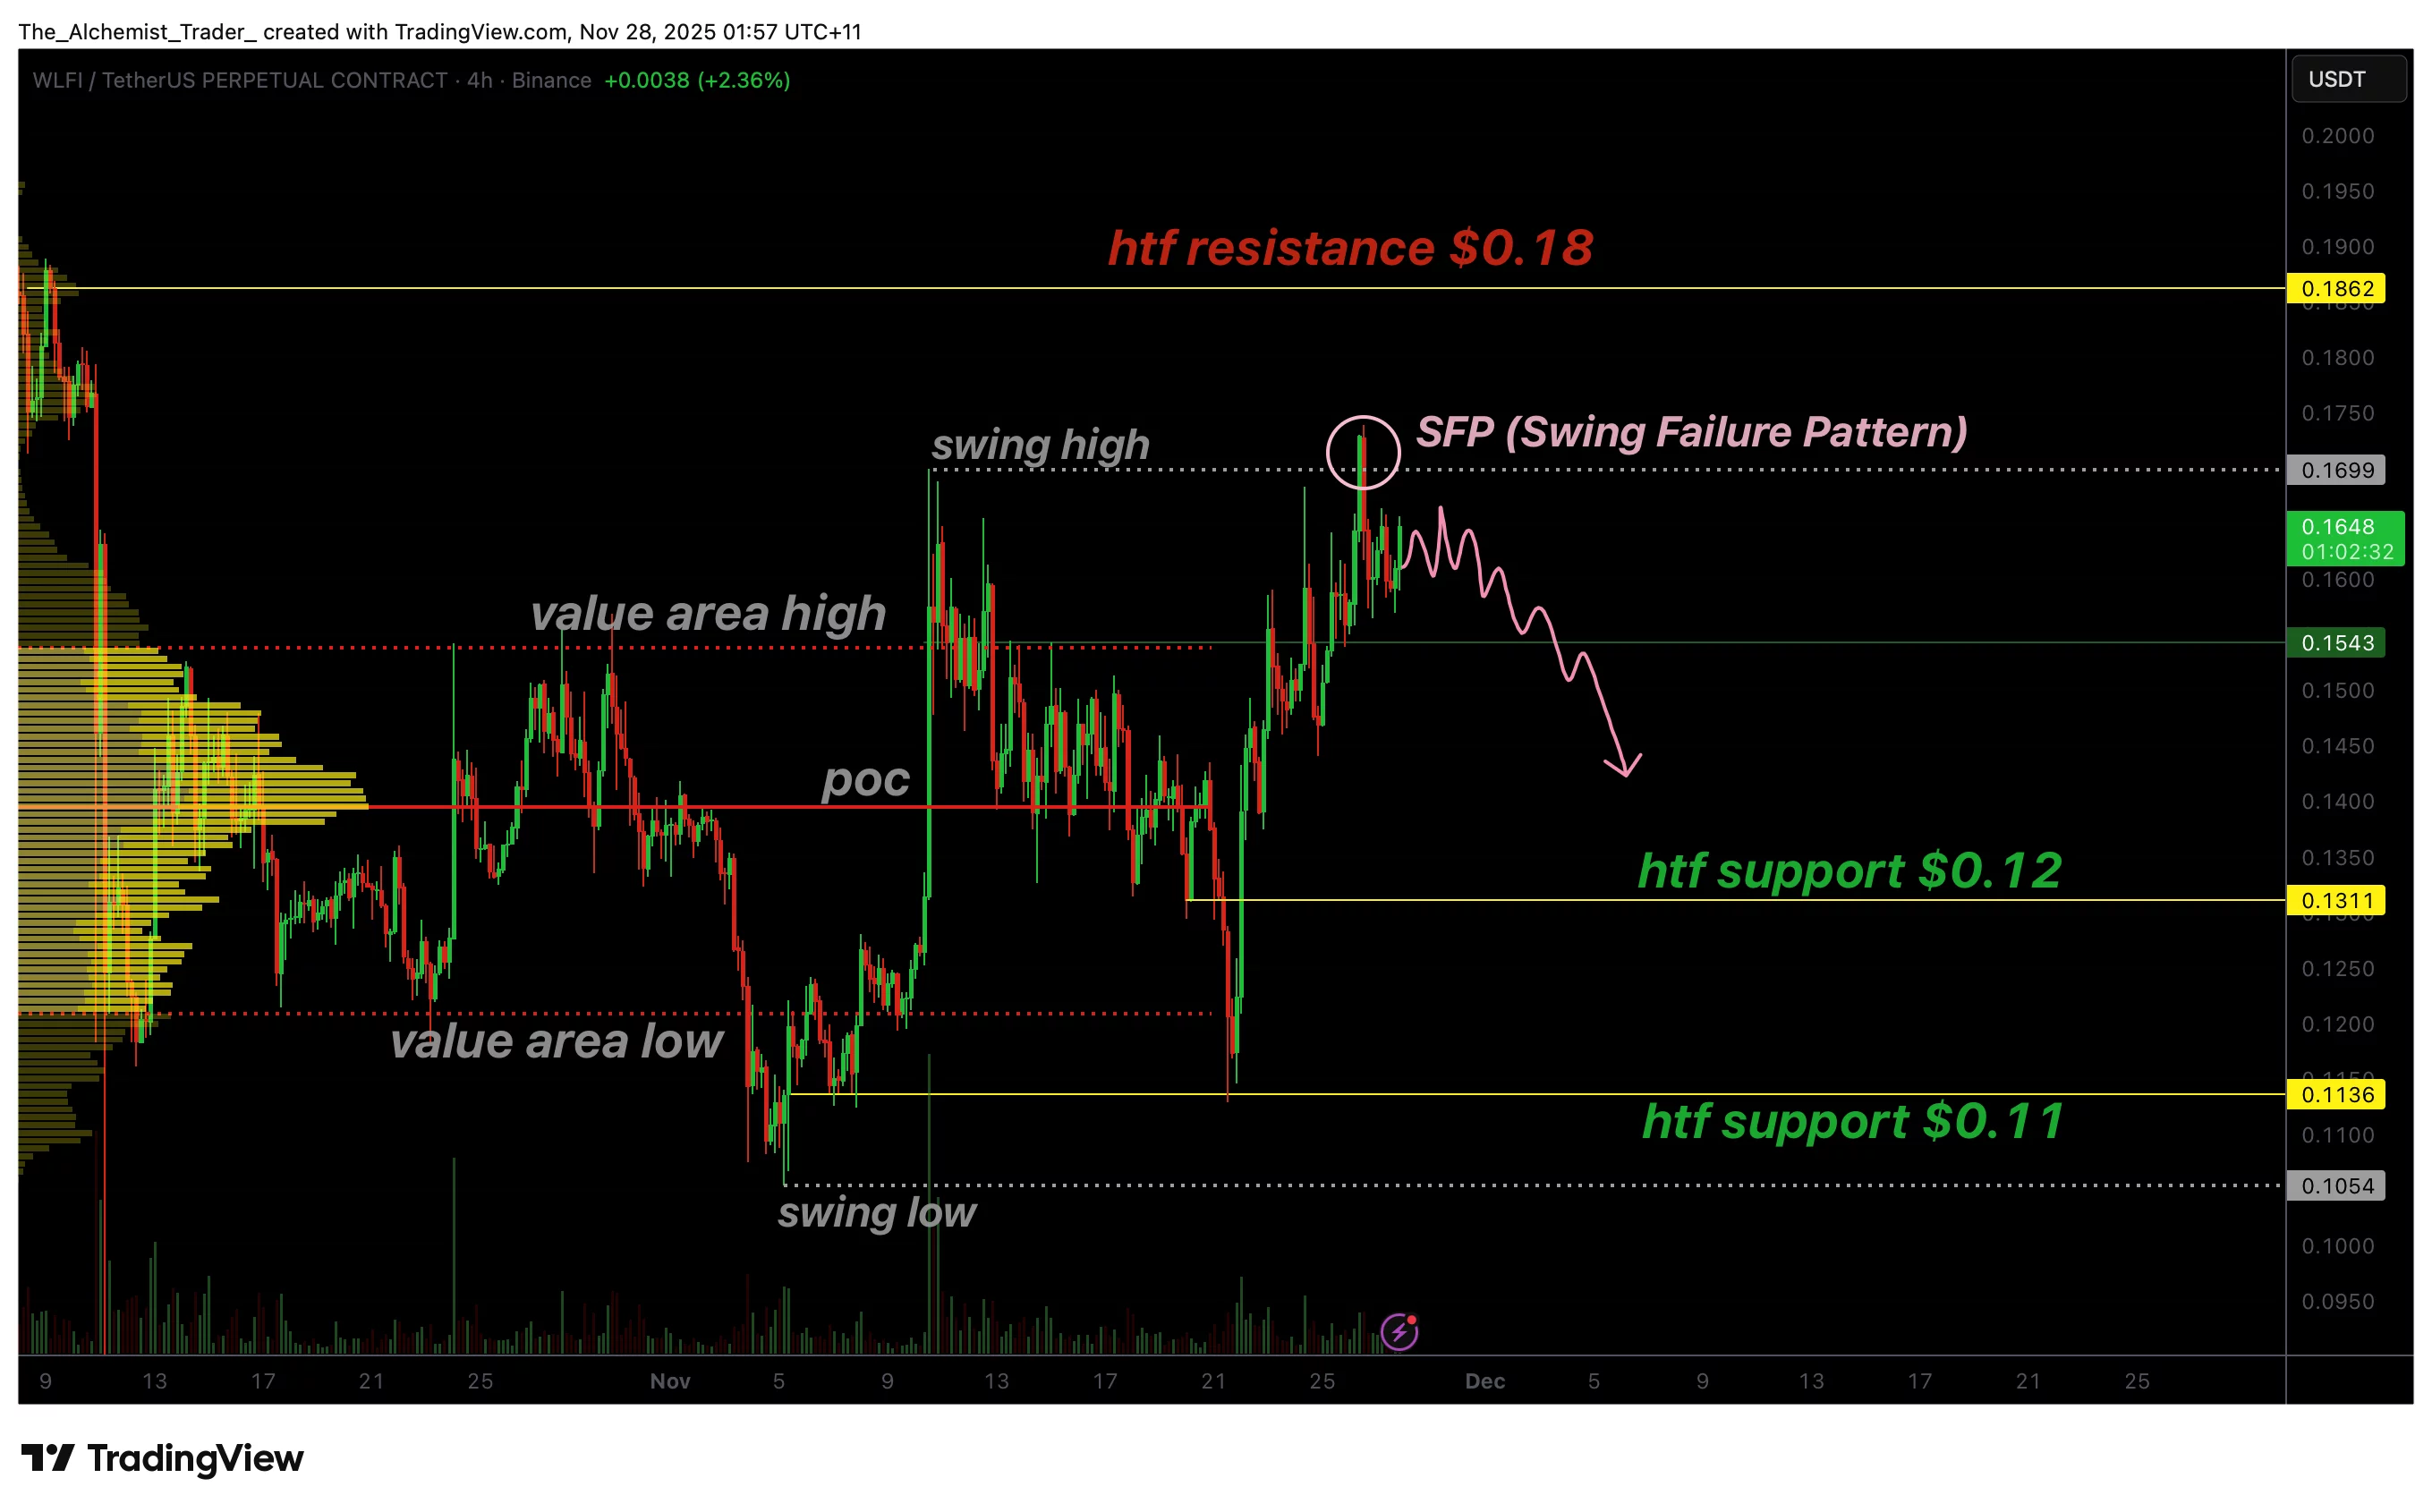
WLFI’s recovery from $0.11 initiated a strong surge toward the previous swing high, but the move quickly showed signs of exhaustion. Once liquidity was taken above that high, price immediately reversed, forming a textbook Swing Failure Pattern, a signal that buyers failed to sustain the breakout and were likely absorbed by larger-time-frame sellers. This has shifted sentiment and structure toward a more cautious, bearish outlook.

The region around $0.16, representing the value area high, is now the defining level in the short term. As long as WLFI trades beneath this threshold, the SFP remains fully active and downside continuation remains the higher-probability scenario.

A reclaim would significantly weaken the bearish case, but order flow suggests buyers remain hesitant while sellers reclaim control of the chart. Volume during the rejection further supports the view that the SFP is not a minor deviation but a meaningful structural break.

If WLFI remains capped below the SFP zone and value area high, the next logical target becomes the high-time-frame support near $0.12. This region previously acted as a critical base for upward expansion and represents the strongest demand zone locally.

A move into this area would not be unexpected, especially considering the impulsive nature of the rejection and the broader market’s tendency to retest major supports following liquidity grabs.

What to expect in the coming price action

If WLFI cannot reclaim the $0.16 value area high, bearish continuation into $0.12 remains the most probable outcome. A strong reclaim of the SFP region would be required to invalidate this downside trajectory.

Market Opportunity
WLFI Logo
WLFI Price(WLFI)
$0.1689
$0.1689$0.1689
+1.80%
USD
WLFI (WLFI) Live Price Chart
Disclaimer: The articles reposted on this site are sourced from public platforms and are provided for informational purposes only. They do not necessarily reflect the views of MEXC. All rights remain with the original authors. If you believe any content infringes on third-party rights, please contact service@support.mexc.com for removal. MEXC makes no guarantees regarding the accuracy, completeness, or timeliness of the content and is not responsible for any actions taken based on the information provided. The content does not constitute financial, legal, or other professional advice, nor should it be considered a recommendation or endorsement by MEXC.

You May Also Like

The Surprising 2025 Decline In Online Interest Despite Market Turmoil

The Surprising 2025 Decline In Online Interest Despite Market Turmoil

The post The Surprising 2025 Decline In Online Interest Despite Market Turmoil appeared on BitcoinEthereumNews.com. Bitcoin Searches Plunge: The Surprising 2025
Share
BitcoinEthereumNews2026/01/21 14:56
Cryptos Signal Divergence Ahead of Fed Rate Decision

Cryptos Signal Divergence Ahead of Fed Rate Decision

The post Cryptos Signal Divergence Ahead of Fed Rate Decision appeared on BitcoinEthereumNews.com. Crypto assets send conflicting signals ahead of the Federal Reserve’s September rate decision. On-chain data reveals a clear decrease in Bitcoin and Ethereum flowing into centralized exchanges, but a sharp increase in altcoin inflows. The findings come from a Tuesday report by CryptoQuant, an on-chain data platform. The firm’s data shows a stark divergence in coin volume, which has been observed in movements onto centralized exchanges over the past few weeks. Bitcoin and Ethereum Inflows Drop to Multi-Month Lows Sponsored Sponsored Bitcoin has seen a dramatic drop in exchange inflows, with the 7-day moving average plummeting to 25,000 BTC, its lowest level in over a year. The average deposit per transaction has fallen to 0.57 BTC as of September. This suggests that smaller retail investors, rather than large-scale whales, are responsible for the recent cash-outs. Ethereum is showing a similar trend, with its daily exchange inflows decreasing to a two-month low. CryptoQuant reported that the 7-day moving average for ETH deposits on exchanges is around 783,000 ETH, the lowest in two months. Other Altcoins See Renewed Selling Pressure In contrast, other altcoin deposit activity on exchanges has surged. The number of altcoin deposit transactions on centralized exchanges was quite steady in May and June of this year, maintaining a 7-day moving average of about 20,000 to 30,000. Recently, however, that figure has jumped to 55,000 transactions. Altcoins: Exchange Inflow Transaction Count. Source: CryptoQuant CryptoQuant projects that altcoins, given their increased inflow activity, could face relatively higher selling pressure compared to BTC and ETH. Meanwhile, the balance of stablecoins on exchanges—a key indicator of potential buying pressure—has increased significantly. The report notes that the exchange USDT balance, around $273 million in April, grew to $379 million by August 31, marking a new yearly high. CryptoQuant interprets this surge as a reflection of…
Share
BitcoinEthereumNews2025/09/18 01:01
Strategy Makes Biggest Bitcoin Bet In Months With $2.13B Buy

Strategy Makes Biggest Bitcoin Bet In Months With $2.13B Buy

The post Strategy Makes Biggest Bitcoin Bet In Months With $2.13B Buy appeared on BitcoinEthereumNews.com. Strategy Makes Biggest Bitcoin Bet In Months
Share
BitcoinEthereumNews2026/01/21 15:07