The post SEI Price Prediction 2026: Can the Token Reclaim $1? appeared first on Coinpedia Fintech News Amid the chaos and volatility of popular tokens like BitcoinThe post SEI Price Prediction 2026: Can the Token Reclaim $1? appeared first on Coinpedia Fintech News Amid the chaos and volatility of popular tokens like Bitcoin

SEI Price Prediction 2026: Can the Token Reclaim $1?

2026/01/24 13:09
4 min read
SEI Price Prediction 2025: Is SEI Crypto Ready for a Double-Bottom 400% Reversal?

The post SEI Price Prediction 2026: Can the Token Reclaim $1? appeared first on Coinpedia Fintech News

Amid the chaos and volatility of popular tokens like Bitcoin, XRP, and memecoins, here is an altcoin building a stronger base. SEI, built by combining the network effects of Ethereum and Solana, is set to outperform all major cryptos in the coming days. The ecosystem is getting upgraded, as the on-chain data suggests a steady growth in user participation. Put together, the SEI price could be the next big thing in the crypto space as it is approaching the edge of the consolidation. 

What’s Happening Within the Sei Ecosystem?

Sei is entering an high impact transition phase where the tech roadmap and liquidity flows have grabbed more attention. The ecosystem aims to simplify the building and improve the performance, which may attract short-term friction. Here’s what’s happening within the Sei ecosystem that may impact the price in the near term. 

  • Sei is pivoting toward an EVM-only chain (SIP-3 / “Giga” direction): staking via EVM first, then inbound IBC transfers get disabled, followed by a broader IBC wind-down.
  • The IBC shutdown forces a liquidity/migration moment: users holding Cosmos-native assets on Sei (often cited: USDC.n) are being pushed to migrate to native USDC ahead of the cutoff window.
  • Narrative shift: Sei is positioned as a performance-first EVM L1 (simpler stack, faster execution), instead of a dual Cosmos+EVM identity.
  • Infra/tooling push: ecosystem messaging is emphasising stronger RPC + dev tooling + wallet onboarding (bigger “plug-and-play” stack for EVM builders).

Sei is in a transition-heavy phase where the story isn’t just “new upgrades,” but how liquidity behaves during the shift. On-chain, the network is still relatively small but active: Sei has ~$128.22M in TVL, ~$67.11M in stablecoins (down 6.12% over 7 days), and ~$2.07M in net inflows over the last 24 hours. Trading activity is notable too—DEX volume is ~$21.59M (24h) and ~$141.31M (7d) (up 25.98% WoW), while perps volume is ~$19.33M (24h) and ~$134.39M (7d) (down 1.84% WoW). On the monetisation side, Sei is seeing ~$13,832 in app fees (24h) versus ~$311 in chain fees (24h)—a split that’s useful for judging where real usage is showing up. 

SEI Price Prediction: Will it Reach $1 in 2026?

SEI gained immense popularity in the first few days of its trade, when the price reached the highs above $1.14. Since then, the rally has been forming consecutive lower highs and lows as the bears have been dominating. However, the bearish influence over the token could ease in the coming days, as the rally is approaching the edge of the consolidation. 

SEI’s weekly chart shows a market that has been compressing for months as price trends lower within a broad descending structure. After a strong 2024 expansion, momentum has steadily faded, pushing SEI back toward long-term support near the $0.10–$0.12 region. This zone now sits at the intersection of historical demand and a falling trendline, making it a critical area where the next medium-term directional move is likely to be decided.

sei price

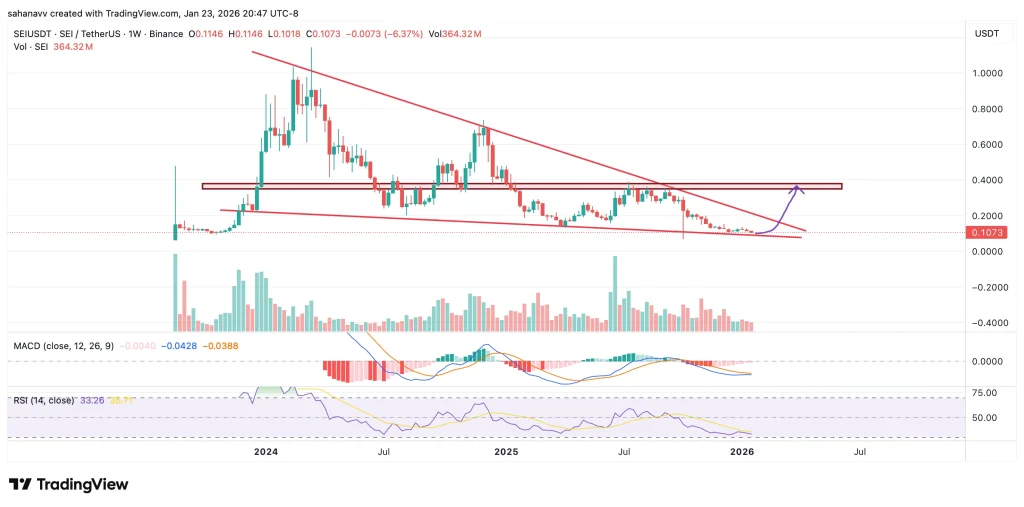
Technically, SEI remains below a long-term descending resistance, with repeated failures near the $0.35–$0.40 supply zone confirming seller control. Price is currently hugging trendline support, while RSI stays weak near the low 30s, suggesting bearish momentum but also growing downside exhaustion. MACD remains negative, though selling pressure is slowing. A sustained bounce from this base could trigger a relief rally toward resistance, while a clean breakdown would expose new cycle lows.

Will the SEI Price Reach $1 in 2026?

SEI reaching $1 in 2026 is possible, but it’s not the base case from this chart. Price is still in a long-term downtrend and sitting near support, so the first job is to reclaim and hold the $0.35–$0.40 supply zone. For a $1 run, SEI likely needs a clean trend reversal, rising liquidity (stablecoins), and sustained app usage, plus a supportive broader market. If the rally fails at resistance, $1 stays a stretch target.

Disclaimer: The articles reposted on this site are sourced from public platforms and are provided for informational purposes only. They do not necessarily reflect the views of MEXC. All rights remain with the original authors. If you believe any content infringes on third-party rights, please contact service@support.mexc.com for removal. MEXC makes no guarantees regarding the accuracy, completeness, or timeliness of the content and is not responsible for any actions taken based on the information provided. The content does not constitute financial, legal, or other professional advice, nor should it be considered a recommendation or endorsement by MEXC.

You May Also Like

Dramatic Spot Crypto ETF Outflows Rock US Market

Dramatic Spot Crypto ETF Outflows Rock US Market

BitcoinWorld Dramatic Spot Crypto ETF Outflows Rock US Market The cryptocurrency market is always buzzing with activity, and recent developments surrounding US spot Bitcoin and Ethereum ETFs have certainly grabbed attention. After a brief period of inflows, these prominent investment vehicles experienced a significant reversal, recording notable Spot Crypto ETF Outflows on September 22. This shift has sparked discussions among investors and analysts alike, prompting a closer look at what drove these movements and their potential implications for the broader digital asset landscape. What Triggered These Dramatic Spot Crypto ETF Outflows? On September 22, both US spot Bitcoin and Ethereum ETFs collectively observed net outflows, effectively ending a two-day streak of positive inflows. This sudden reversal indicates a potential shift in investor sentiment or market dynamics. Understanding the specifics of these Spot Crypto ETF Outflows is crucial for anyone tracking the pulse of the crypto market. Data from Trader T revealed that spot Bitcoin ETFs alone registered total net outflows amounting to $363.17 million. This substantial figure highlights a notable selling pressure across several key funds. Fidelity’s FBTC led the pack with $276.68 million in outflows. Ark Invest’s ARKB followed, seeing $52.30 million depart. Grayscale’s GBTC, a long-standing player, recorded $24.65 million in outflows. VanEck’s HODL also contributed with $9.54 million. Interestingly, BlackRock’s IBIT and several other funds reported zero flows on this particular day, indicating a concentrated selling activity in specific products rather than a market-wide exodus. How Did Ethereum ETFs Respond to the Spot Crypto ETF Outflows? The trend of net outflows wasn’t limited to Bitcoin. Spot Ethereum ETFs also faced considerable pressure, collectively experiencing $76.06 million in net outflows during the same period. This indicates a broader market sentiment affecting both major cryptocurrencies. Fidelity’s FETH accounted for $33.12 million of the outflows. Bitwise’s ETHW saw $22.30 million withdrawn. BlackRock’s ETHA registered $15.19 million in outflows. Grayscale’s Mini ETH contributed $5.45 million to the total. These figures underscore that while Bitcoin ETFs saw larger absolute outflows, Ethereum ETFs also experienced a significant cooling of investor interest. Such synchronized movements often suggest overarching market factors rather than isolated fund-specific issues. What Are the Broader Implications of These Spot Crypto ETF Outflows? The reversal from inflows to substantial Spot Crypto ETF Outflows could signal a few things. It might reflect profit-taking by investors after recent market rallies, or it could indicate a cautious stance due to macroeconomic uncertainties. Moreover, such movements can influence market sentiment, potentially leading to increased volatility in the short term. For investors, monitoring these ETF flows provides valuable insights into institutional and retail sentiment. Significant outflows can sometimes precede price corrections, offering an opportunity for strategic re-evaluation. Conversely, sustained inflows often suggest growing confidence in digital assets. It is important to remember that ETF flows are just one metric among many. A holistic view, considering on-chain data, macroeconomic indicators, and regulatory news, is essential for making informed decisions in the dynamic crypto space. These Spot Crypto ETF Outflows serve as a reminder of the market’s inherent volatility and the need for continuous vigilance. In summary, the recent dramatic Spot Crypto ETF Outflows from US Bitcoin and Ethereum funds mark a notable shift in the investment landscape. While a two-day inflow streak was broken, these movements are a natural part of a maturing market. They highlight the ebb and flow of investor confidence and the dynamic nature of digital asset investments. As the market continues to evolve, keeping a close eye on these ETF trends will remain crucial for understanding broader sentiment and potential future directions. Frequently Asked Questions (FAQs) Q1: What does “net outflows” mean for crypto ETFs? A1: Net outflows occur when investors redeem more shares from an ETF than they purchase, indicating more money is leaving the fund than entering it. Q2: Which US spot Bitcoin ETFs saw the largest outflows? A2: Fidelity’s FBTC led with $276.68 million in outflows, followed by Ark Invest’s ARKB and Grayscale’s GBTC, contributing significantly to the overall Spot Crypto ETF Outflows. Q3: Were Ethereum ETFs also affected by outflows? A3: Yes, US spot Ethereum ETFs experienced $76.06 million in net outflows, with Fidelity’s FETH and Bitwise’s ETHW being major contributors. Q4: What do these Spot Crypto ETF Outflows suggest about market sentiment? A4: They can suggest a shift towards profit-taking, increased caution due to macroeconomic factors, or a temporary cooling of investor interest in digital assets. Did you find this analysis of Spot Crypto ETF Outflows insightful? Share this article with your network on social media to help others understand the latest trends in the crypto ETF market and contribute to informed discussions! To learn more about the latest crypto market trends, explore our article on key developments shaping Bitcoin and Ethereum institutional adoption. This post Dramatic Spot Crypto ETF Outflows Rock US Market first appeared on BitcoinWorld.
Share
Coinstats2025/09/23 10:55
Remittix Success Leads To Rewarding Presale Investors With 300% Bonus – Here’s How To Get Involved

Remittix Success Leads To Rewarding Presale Investors With 300% Bonus – Here’s How To Get Involved

Besides its enormous presale success, Remittix is also extending a 300% bonus to early purchasers. This temporary bonus can be […] The post Remittix Success Leads
Share
Coindoo2026/02/07 16:39
Korean Crypto Exchange Bithumb Accidentally Gives Away Millions in Bitcoin During Promotion

Korean Crypto Exchange Bithumb Accidentally Gives Away Millions in Bitcoin During Promotion

TLDR Bithumb accidentally sent excess Bitcoin to customers during a promotional “Random Box” event in South Korea Some users reportedly received 2,000 BTC ($139
Share
Coincentral2026/02/07 16:39