Bitcoin Magazine Bitcoin Drops Below $87,000 as Bears Target $84,000 Support Break Bitcoin closed the week at $86,588 after losing $87,000 support, with bears Bitcoin Magazine Bitcoin Drops Below $87,000 as Bears Target $84,000 Support Break Bitcoin closed the week at $86,588 after losing $87,000 support, with bears

Bitcoin Drops Below $87,000 as Bears Target $84,000 Support Break

2026/01/27 01:26
5 min read

Bitcoin Magazine

Bitcoin Drops Below $87,000 as Bears Target $84,000 Support Break

Bitcoin Price Weekly Outlook

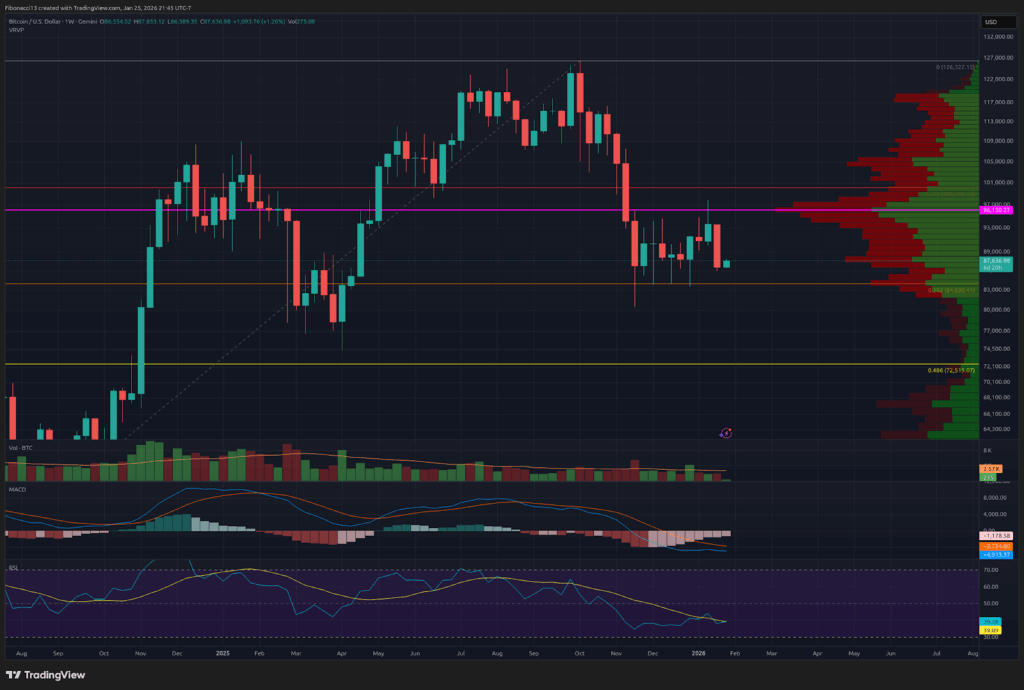
What a disastrous weekly close for Bitcoin, that about sums it up. After tapping $98,000 resistance the week prior, the bitcoin price just went straight down last week to close near the lows at $86,588. The bulls have been corralled back into their pens and will need a lot of help to break out once again. The bears will look to continue their momentum into this week to break down the $84,000 support level once and for all, and take the price down to the low $70,000 area. Bulls must defend $84,000 like never before to avoid a breakdown this week.

Bitcoin Drops Below $87,000 as Bears Target $84,000 Support Break

Key Support and Resistance Levels Now

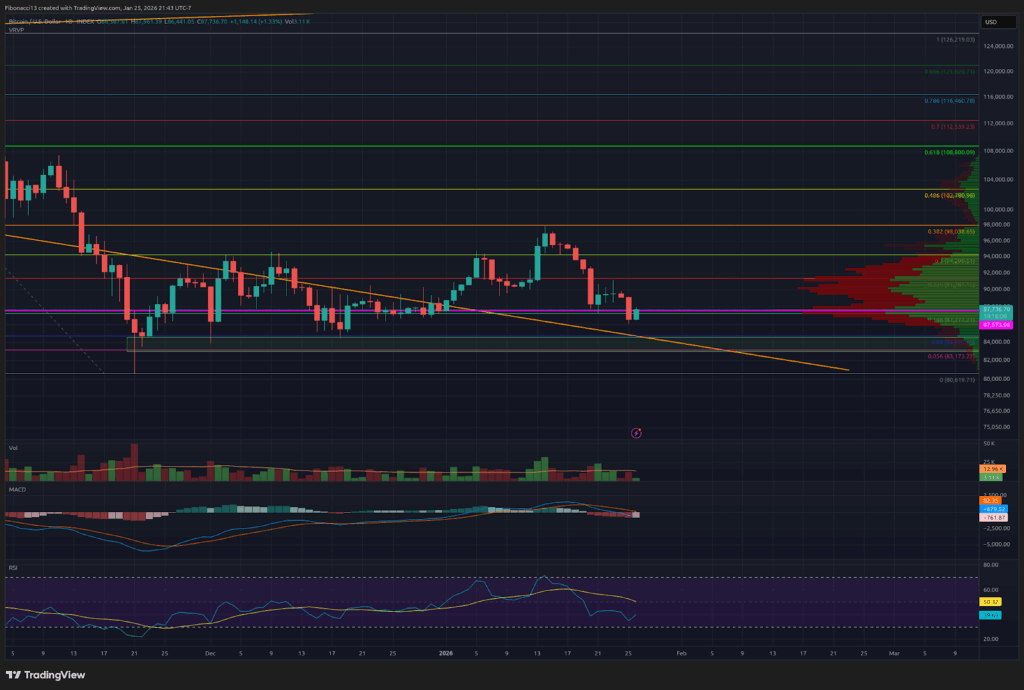
The bears are back in town. $87,000 support has been lost, and $84,000 may not hold another test. If the bears can manage to get a daily close or two below $84,000, the price should accelerate down to the $72,000 to $68,000 support zone. We likely see a bounce from down there, but if it eventually gives wa,y we will look to the 0.618 Fibonacci retracement level at $58,000.

After grinding above several resistance levels recently, the bulls are back where they started. Bulls must reclaim $88,000 first and foremost. From there, they will look to get above $91,400, then $94,000 once again. $98,000 has proven itself as strong resistance above here. In the unlikely event the bulls can push above $98,000, it should be a slow go up to $103,500.

Bitcoin Drops Below $87,000 as Bears Target $84,000 Support Break

Outlook For This Week

This week is make-or-break for the bulls. Failure to defend $84,000 this week will likely send the price down to new lows. There is a large slate of big companies reporting earnings this week, so if the results are very strong, it could help buoy the bitcoin price to sustain major support levels. Although correlations to stocks have been weak lately, there are no guarantees that bitcoin will benefit from any upward market movement. Odds are in the bears’ favor for a breakdown this week.

Market mood: Bearish – The bulls showed some strength in the prior week for a slight advantage, but the bears took full control last week, driving the price right back down to the lows.

The next few weeks

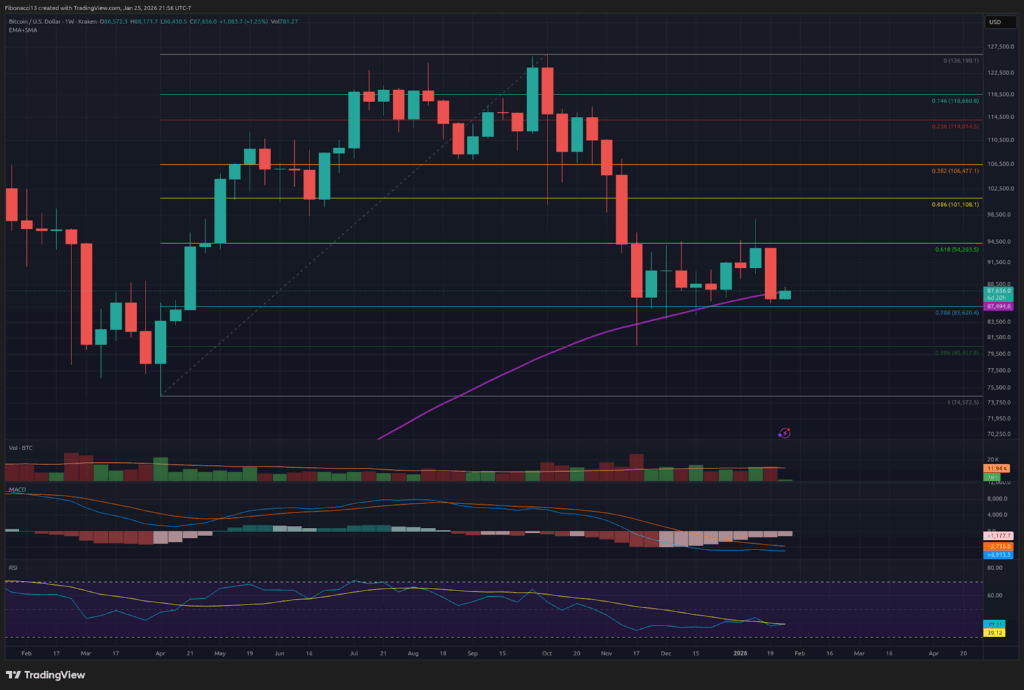
The weekly chart was looking for a bounce recently, and it got one. The price action this past week, however, has put in a strong indication that this bounce may be over and new lows may be on the horizon as the price closed below the 100-week SMA. The MACD oscillator is firmly in bearish territory, and while it looked like it may see a bullish cross last week, the bears came out in force and prevented that bullish cross from taking place. The relative strength index has crossed back down below the 13 SMA and sits in a bearish posture once again.

Bitcoin Drops Below $87,000 as Bears Target $84,000 Support Break

Terminology Guide

Bulls/Bullish: Buyers or investors expecting the price to go higher.

Bears/Bearish: Sellers or investors expecting the price to go lower.

Support or support level: A level at which the price should hold for the asset, at least initially. The more touches on support, the weaker it gets and the more likely it is to fail to hold the price.

Resistance or resistance level: Opposite of support.  The level that is likely to reject the price, at least initially. The more touches at resistance, the weaker it gets and the more likely it is to fail to hold back the price.

SMA: Simple Moving Average. Average price based on closing prices over the specified period. In the case of RSI, it is the average strength index value over the specified period.

Oscillators: Technical indicators that vary over time, but typically remain within a band between set levels. Thus, they oscillate between a low level (typically representing oversold conditions) and a high level (typically representing overbought conditions). E.G., Relative Strength Index (RSI) and Moving Average Convergence-Divergence (MACD).

RSI Oscillator: The Relative Strength Index is a momentum oscillator that moves between 0 and 100. It measures the speed of the price and changes in the speed of the price movements. When RSI is over 70, it is considered to be overbought. When RSI is below 30, it is considered to be oversold.

MACD Oscillator: Moving Average Convergence-Divergence is a momentum oscillator that subtracts the difference between 2 moving averages to indicate trend as well as momentum.

Fibonacci Retracements and Extensions: Ratios based on what is known as the golden ratio, a universal ratio pertaining to growth and decay cycles in nature. The golden ratio is based on the constants Phi (1.618) and phi (0.618).

This post Bitcoin Drops Below $87,000 as Bears Target $84,000 Support Break first appeared on Bitcoin Magazine and is written by Ethan Greene - Feral Analysis and Juan Galt.

Disclaimer: The articles reposted on this site are sourced from public platforms and are provided for informational purposes only. They do not necessarily reflect the views of MEXC. All rights remain with the original authors. If you believe any content infringes on third-party rights, please contact service@support.mexc.com for removal. MEXC makes no guarantees regarding the accuracy, completeness, or timeliness of the content and is not responsible for any actions taken based on the information provided. The content does not constitute financial, legal, or other professional advice, nor should it be considered a recommendation or endorsement by MEXC.

You May Also Like

Bitcoin Whales Sell 147,000 BTC Since August, Fastest Selloff Of Cycle

Bitcoin Whales Sell 147,000 BTC Since August, Fastest Selloff Of Cycle

On-chain data shows the Bitcoin whales are selling at their fastest monthly rate of the cycle, a potential reason behind the asset’s latest decline. Bitcoin Whale Holdings Have Significantly Dropped Over The Past Month In a new post on X, CryptoQuant Head of Research Julio Moreno has listed a contributing factor behind the recent plunge in the Bitcoin price. The factor in question is the trend in the holdings of the whales. Whales are defined as BTC investors carrying more than 1,000 tokens of the cryptocurrency in their wallet balance. At the current exchange rate, this cutoff converts to about $112.8 million. Thus, the only holders qualifying for the group would be those with a substantial amount of capital. Related Reading: Bitcoin Dip-Buy Calls Spike: Why This Could Actually Be Bearish Exchanges and mining pool wallets may technically fulfill this requirement, but they are excluded from the group because they aren’t considered “normal” network participants. Given that the whales include some of the most influential investors in the market, their behavior can be something to keep an eye on, as it may sometimes have a direct impact on the asset’s trajectory. Even when it doesn’t, it can still be revealing about the sentiment among these humongous holders. One way to gauge whale behavior is through their total supply. Below is the chart shared by Moreno that shows how this metric has changed over the past year. As displayed in the graph, the Bitcoin whale supply saw a huge drawdown last month, indicating that the large holders participated in some significant net distribution. The metric made some slight recovery as BTC’s spot price surged above $117,000, but the trend has quickly flipped during the last few days as the indicator has registered another sharp plunge. Related Reading: Here’s The Boundary Bitcoin Bulls Must Defend To Save Rally Since August 21st, whales have sold a net total of 147,000 BTC, worth a whopping $16.6 billion. This selloff has taken the 30-day change in the cohort’s supply to the largest negative value of the cycle so far. Considering the timing of the selling, it’s possible that this is one of the reasons why Bitcoin has faced bearish price action recently. The market selloff may not be over yet, either, if the trend in the Exchange Inflow is anything to go by. As the CryptoQuant head has pointed out in another X post, the Bitcoin Exchange Inflow witnessed a surge on Tuesday. Investors generally deposit their coins in centralized exchanges when they want to participate in one of the services that they provide, which can include selling. As such, the growth in the Exchange Inflow could be a sign that holders are still trading away their Bitcoin. BTC Price Bitcoin slipped under $112,000 on Tuesday, but the coin has seen a slight bounce since then as its price has climbed to $113,000. Featured image from Dall-E, CryptoQuant.com, chart from TradingView.com
Share
NewsBTC2025/09/25 02:00
Travelzoo Q4 2025 Earnings Conference Call on February 19 at 11:00 AM ET

Travelzoo Q4 2025 Earnings Conference Call on February 19 at 11:00 AM ET

NEW YORK, Feb. 9, 2026 /PRNewswire/ — Travelzoo® (NASDAQ: TZOO): WHAT: Travelzoo, the club for travel enthusiasts, will host a conference call to discuss the Company
Share
AI Journal2026/02/10 01:46
TradFi vs. Crypto: Bybit Launches 300,000 USDT Trading Challenge as Copy Trading Gains Momentum in Volatility

TradFi vs. Crypto: Bybit Launches 300,000 USDT Trading Challenge as Copy Trading Gains Momentum in Volatility

DUBAI, UAE, Feb. 9, 2026 /PRNewswire/ — Bybit, the world’s second-largest cryptocurrency exchange by trading volume, is calling traders across the TradFi and crypto
Share
AI Journal2026/02/10 01:45