

Bitcoin Price Slides to $70,000 as Glassnode Says ‘BTC Bears Are in Control’—$50,000 at Risk?

The post Bitcoin Price Slides to $70,000 as Glassnode Says ‘BTC Bears Are in Control’—$50,000 at Risk? appeared first on Coinpedia Fintech News
Bitcoin is printing massive bearish candles for the third consecutive day, dragging the price down by more than 10% this week. The BTC price hit an intraday low very close to $70,000, but it did not attract strong buying volume. This raises the possibility of the start of the bearish phase, and the data from Glassnode below hints towards a deeper correction.
Bitcoin Slips Below Key Short-Term Holder Cost Basis
The risk indicator shows Bitcoin trading below the Short-Term Holder (STH) realized price, a level that often defines near-term market control. When BTC holds below this red cost-basis line, recent buyers remain underwater, and upside moves typically face selling pressure.
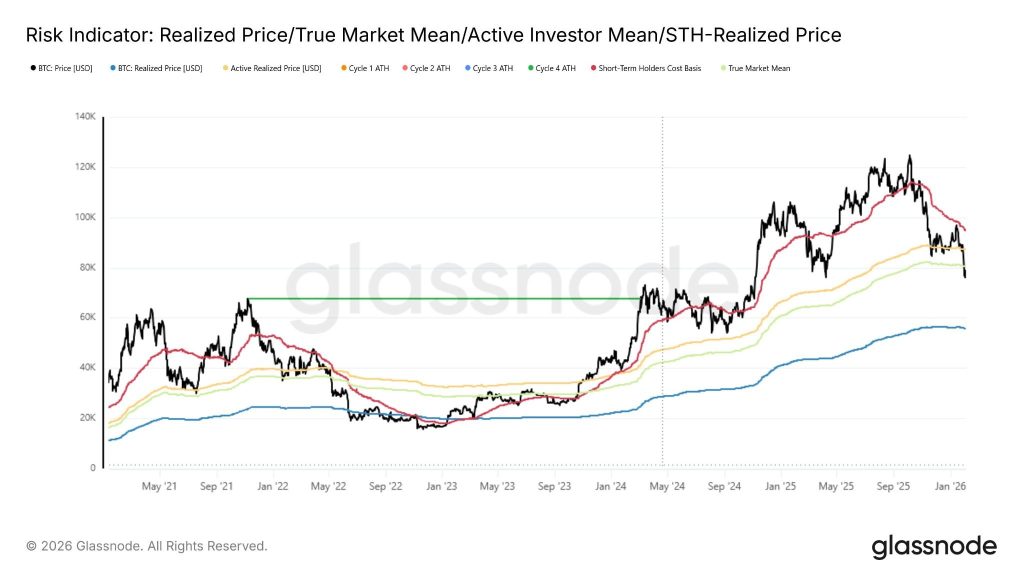
At the same time, price is drifting closer to the Active Investor Mean and True Market Mean, suggesting the market is rotating toward lower on-chain cost bases. Historically, this structure reflects bearish dominance in the short term, with price action driven more by risk reduction than fresh accumulation.
Rising Realized Losses Signal Capitulation
The Realised Loss chart shows a sharp rise in realised losses as Bitcoin’s price continues to decline. The recent spikes indicate that a growing number of investors are selling coins at a loss, reflecting rising stress among short-term participants.
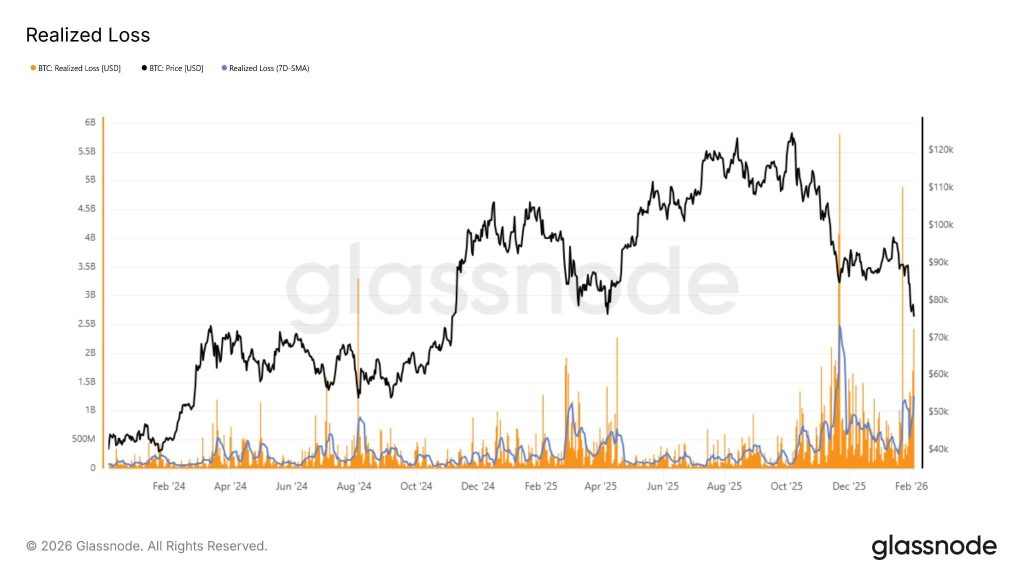
Historically, sustained increases in realized losses tend to appear during corrective or distribution phases, when downside momentum forces weaker hands to exit positions. The elevated 7-day average suggests selling pressure remains active, reinforcing the view that current price action is driven by capitulation rather than confident buying.
Institutional Netflows Turn Negative
The BTC DAT Netflow chart shows a clear shift into negative netflows across spot ETFs, corporate treasuries, and government-linked wallets. This indicates that large holders are distributing rather than accumulating, removing a key source of structural demand.
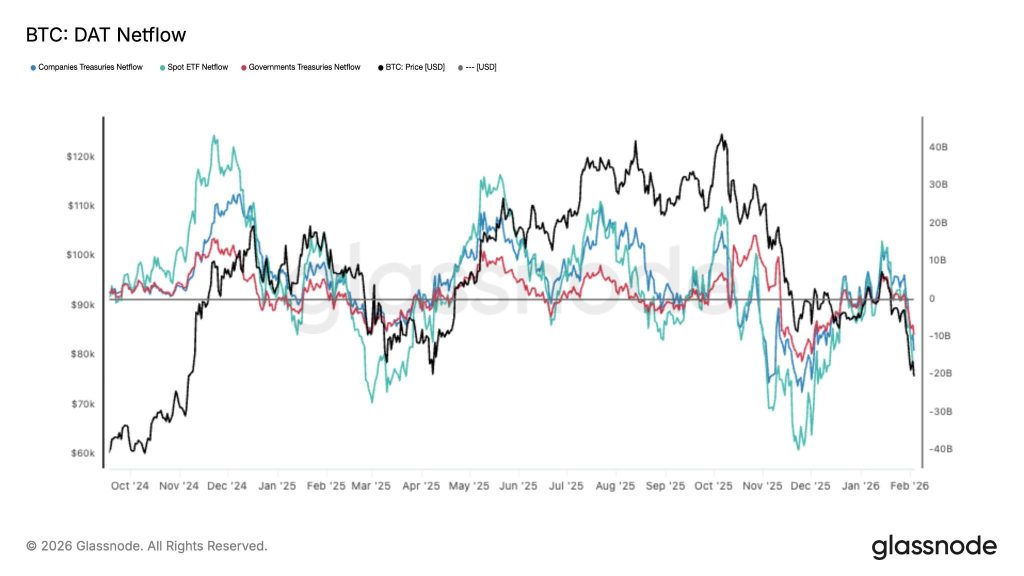
As institutional netflows slip below neutral, Bitcoin price action weakens alongside it, suggesting that recent declines are being reinforced by capital outflows from major entities, not just retail selling. Until netflows stabilize or turn positive, upside momentum remains limited.
Put Option Demand Surges as Traders Hedge Against Bitcoin
The chart shows a sharp rise in put premiums bought for the $75K strike, while net put premiums turn decisively positive. This indicates traders are increasingly paying up for downside protection, reflecting growing bearish expectations in the short to mid term.
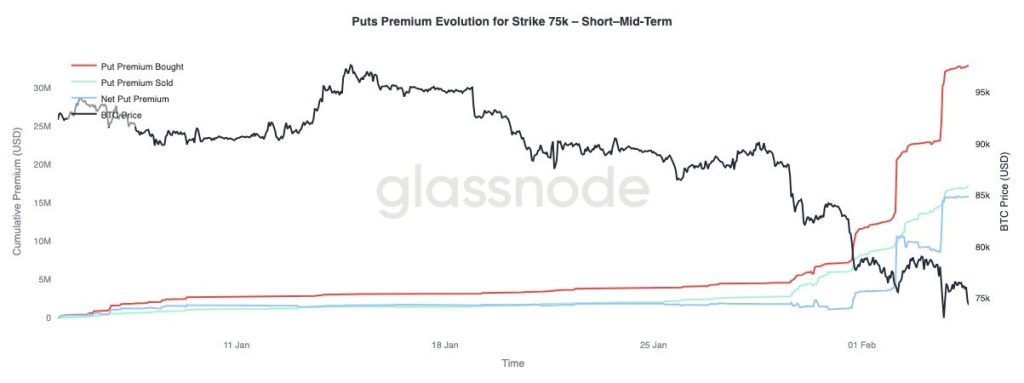
At the same time, Bitcoin price trends lower as put demand accelerates, reinforcing the view that market participants are positioning defensively rather than betting on a near-term rebound. Elevated put activity typically signals risk-off sentiment and heightened downside caution.
The Final Verdict: Are the Bitcoin Bears in Control?
The data shows Bitcoin price is under pressure, but not in free fall. The price sitting below the short-term holder cost basis tells us recent buyers are stuck in losses, which explains why every bounce runs into selling. The rise in realized losses confirms that some traders are now exiting positions under stress, not rotating calmly.
What matters more is that big money isn’t stepping in yet. Institutional netflows remain weak, and the jump in put option demand shows traders are paying for protection rather than betting on a quick recovery. That’s a clear sign of caution, not confidence.
Overall, this looks like a defensive, risk-off phase where the market is trying to find balance after excess optimism. Conditions can still stabilize, but until selling pressure cools and demand improves, upside moves are likely to stay limited and fragile.
You May Also Like

Why Bitcoin Fell 53% in 120 Days Without Any Major Bad News

Trump Ignites Speculation with National Bitcoin Venture
