

Is The Bitcoin Bottom In? Leading On-Chain Analyst Sees A Floor Forming
Bitcoin’s violent drawdown into the low-$60,000s has traders hunting for a floor. One of the market’s best-known on-chain analysts is arguing the risk-reward has shifted meaningfully, even if the “bottom” is still a process rather than a single print.
James “Checkmate” Check, a former lead Glassnode researcher and now the author of Check On Chain, told What Bitcoin Did host Danny Knowles that once Bitcoin pushed into the $60,000 zone, it entered what he described as “deep value” territory across multiple mean-reversion frameworks, at the same time capitulation-style losses spiked to levels last seen at the 2022 cycle lows.
Check’s core framing is blunt: if Bitcoin is headed to zero, none of the models matter. If it’s not, then the statistical setup looks increasingly asymmetric after the selloff.
“If Bitcoin is going to zero, been nice playing. It’s been fun […] have fun playing with your bitcoins,” Check said. “If not, then you start looking at the statistics and the odds and go, ‘Well, if Bitcoin recovers, this is kind of a nice place to be. Don’t lose attention now. This is the time to pay attention.’”
Check was less interested in pinning the move on a single forced seller than in walking through the market structure that made the slide plausible.
Bitcoin Bottoms Are A Process
His conclusion was probabilistic, not declarative. “The odds that we’ve put a bottom in have gone up significantly,” he said, adding later that he’d put the chance the market already set a meaningful low at “more than 50/50 […] probably 60%,” while assigning just “15–20%” odds of a new all-time high in 2026 without a major macro “pivot” or “big print” event.
On ETFs, Check cited roughly $7.5 billion in outflows during the drawdown, while arguing the bigger picture looked less like a structural failure and more like positioning unwinds. He said that at around $80,000, roughly 62% of cumulative inflows were underwater, but noted ETF assets under management were down only mid-single digits (he referenced about 4–6%), and suggested earlier outflows aligned with CME open interest, consistent with basis-trade window-dressing rolling off.
Check pushed back hard on anchoring to the four-year halving cycle as a timing tool, calling it an “unnecessary bias.” His approach: watch investor behavior first, check the calendar second. “Show me when investors put the bottom in. Show me when investors sell the top,” he said. “I’m going to look at that instead because then I’ll check the date.”
Even if the low is in, Check expects the market to revisit it. Bottoms, he argued, tend to form through multiple “capitulation wicks” and then “time pain,” where boredom and lingering fear grind down late-cycle buyers. “If you are formulating a bear case right now, you’re doing it wrong,” he said, framing the current zone as the late innings of the move rather than the start, while still allowing price could go lower.
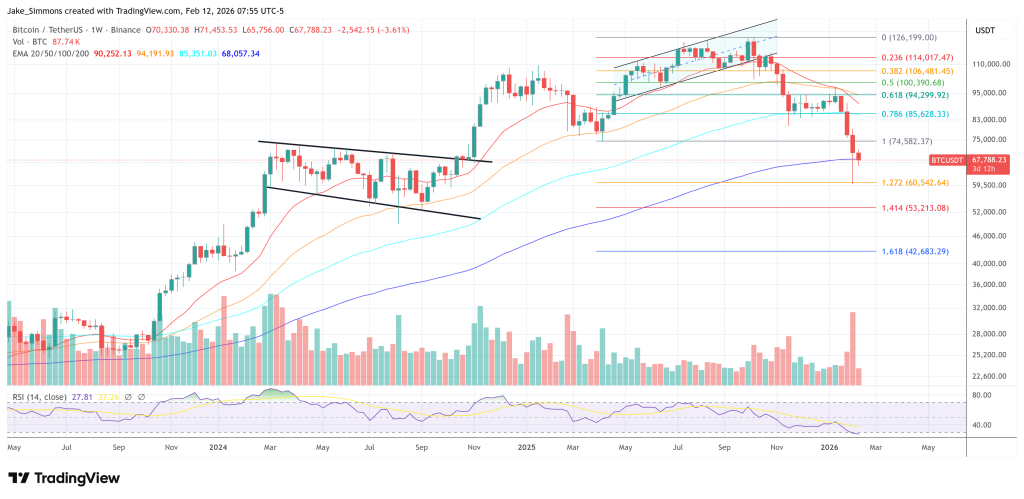
He pointed to two failed all-time-high attempts around October, topping near $126,000, followed by a “shot across the bow” crash on Oct. 10 that he said likely left “bodies out there.” From there, he described a “hodler’s wall” of invested wealth sitting above key levels, with $95,000 as what he called the “bull’s last stand” and argued that once price lost those shelves, downside odds accelerated.
A key reference level for him was $80,000, tied to the True Market Mean, a long-term center-of-gravity price that also overlapped with the ETF cost basis in his telling. Once that level broke, he said, the psychological regime changed: “Losing $80,000 was the acceptance phase. Now everyone believes that it’s a bear market. And what bear markets do, they trend lower.”
From there, Check argued the market was pulled toward the prior high-volume consolidation zone, roughly the mid-$50,000s to $70,000 range, where a large share of this cycle’s trading volume had previously occurred. He said the selloff itself likely involved leverage blowing up somewhere, but framed that as downstream of a broader shift: when the crowd believes it’s a downtrend, they “sell every rip.”
The most concrete “bottoming” signal Check emphasized was the scale of realized losses during the flush. He said capitulation losses ran around $1.5 billion per day, a figure he compared directly to the 2022 bottom and that the sellers were concentrated among recent cohorts: “class of 2025” and “class of 2026” buyers, plus people who bought the $80,000 bear-flag region.
He also flagged SOPR printing around minus one standard deviation, which he said has only appeared in two historical contexts: an early “this isn’t a dip” warning, and later near bottoming phases.
His conclusion was probabilistic, not declarative. “The odds that we’ve put a bottom in have gone up significantly,” he said, adding later that he’d put the chance the market already set a meaningful low at “more than 50/50 […] probably 60%,” while assigning just “15–20%” odds of a new all-time high in 2026 without a major macro “pivot” or “big print” event.
On ETFs, Check cited roughly $7.5 billion in outflows during the drawdown, while arguing the bigger picture looked less like a structural failure and more like positioning unwinds. He said that at around $80,000, roughly 62% of cumulative inflows were underwater, but noted ETF assets under management were down only mid-single digits (he referenced about 4–6%), and suggested earlier outflows aligned with CME open interest, consistent with basis-trade window-dressing rolling off.
Check pushed back hard on anchoring to the four-year halving cycle as a timing tool, calling it an “unnecessary bias.” His approach: watch investor behavior first, check the calendar second. “Show me when investors put the bottom in. Show me when investors sell the top,” he said. “I’m going to look at that instead because then I’ll check the date.”
Even if the low is in, Check expects the market to revisit it. Bottoms, he argued, tend to form through multiple “capitulation wicks” and then “time pain,” where boredom and lingering fear grind down late-cycle buyers. “If you are formulating a bear case right now, you’re doing it wrong,” he said, framing the current zone as the late innings of the move rather than the start, while still allowing price could go lower.
At press time, BTC traded at $67,788.
You May Also Like

Franklin Templeton CEO Dismisses 50bps Rate Cut Ahead FOMC

Why is YZi Labs trying to change the board of CEA Industries?
