

Ripple Crypto Price: XRPUSDT Sitting in a Bearish Pullback With Early Signs of Stabilization

XRPUSDT is trading in a technically weak spot, with the broader market risk-off and the Ripple crypto price weighed down by Bitcoin dominance and extreme fear.
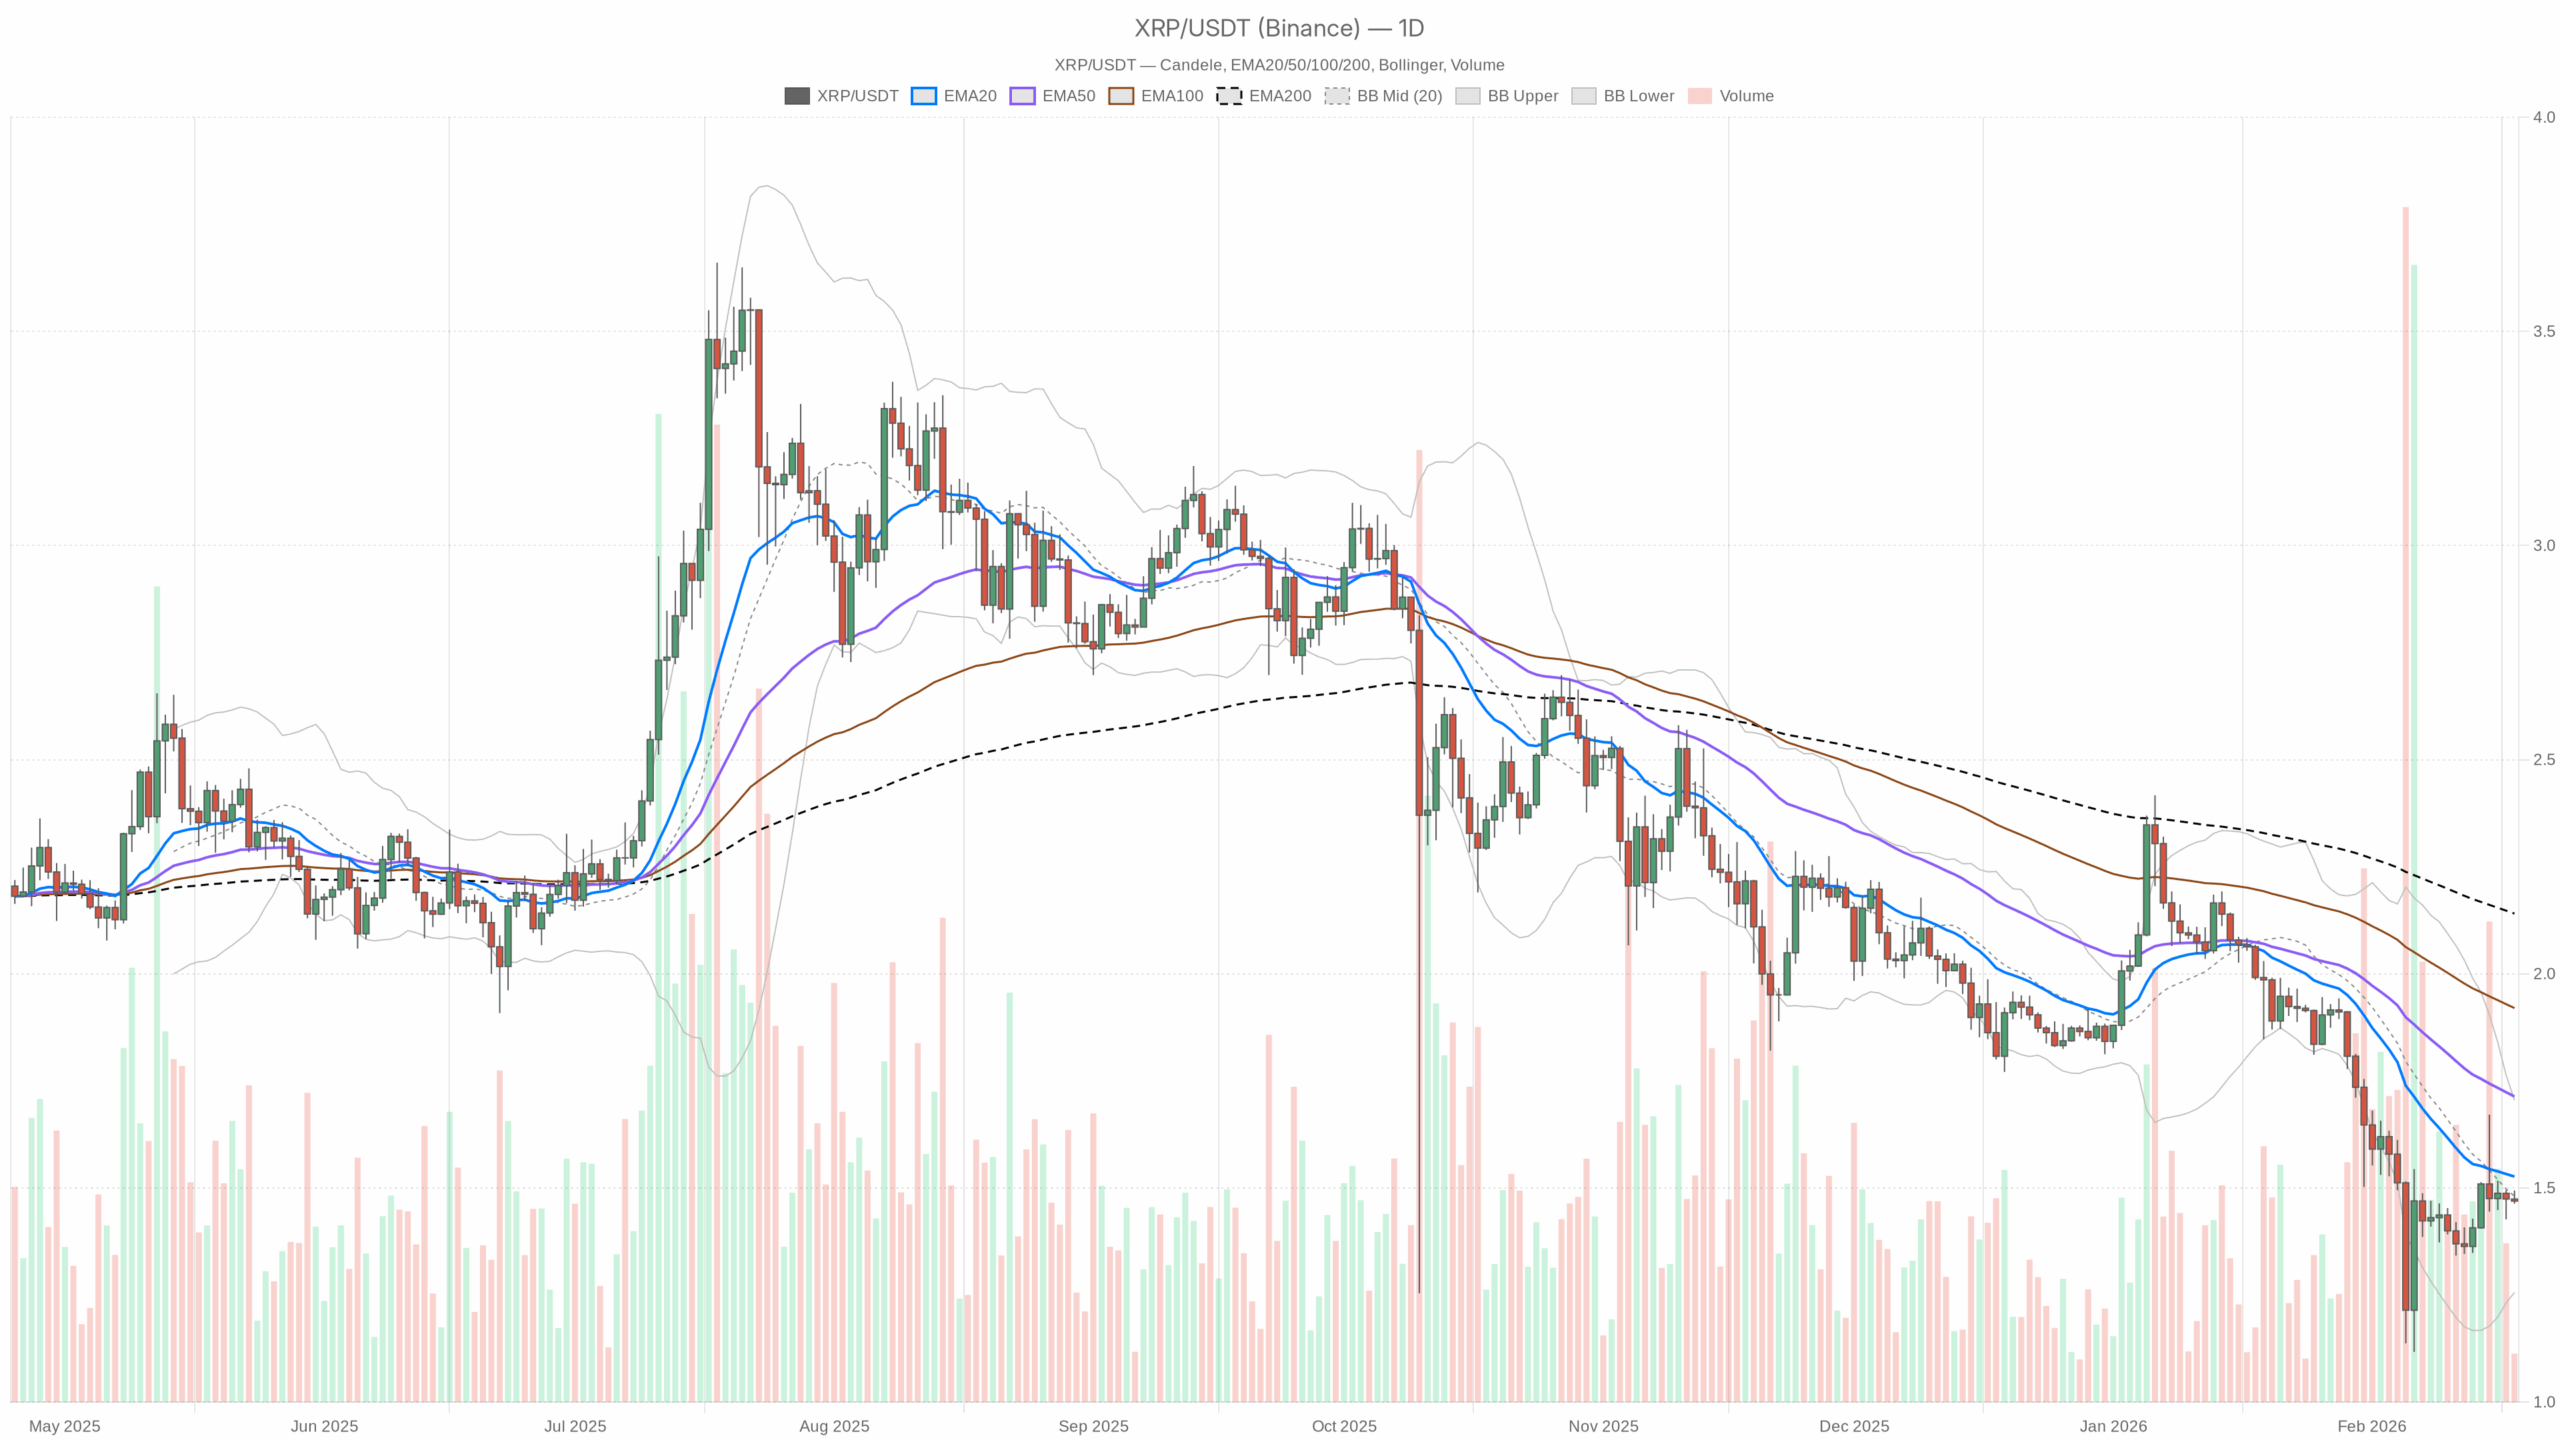 XRP/USDT — daily chart with candlesticks, EMA20/EMA50 and volume.
Daily Timeframe (D1) – Macro Bias: Bearish With Mild Stabilization
The higher timeframe defines the main scenario. Right now, XRPUSDT’s primary bias is bearish, but there are some early signs the downside pressure is easing, not accelerating.
Trend Structure: EMAs
Daily close: 1.47
EMA 20: 1.53
EMA 50: 1.71
EMA 200: 2.14
Price is trading below all three daily EMAs, and the shorter EMAs sit well under the 200-day. That is a textbook bearish structure: the market is trading under recent value (20/50-day) and well below the longer-term trend (200-day). The distance to the 200-day EMA also highlights how extended the broader downtrend still is; XRP would need a sizable rally just to retest that long-term line.
In practice, this means rallies toward 1.53–1.71 are currently rallies into resistance, not into a friendly trend. Moreover, any bullish stance here is, by definition, a countertrend or mean-reversion play until price can reclaim at least the 20-day EMA on a closing basis.
Momentum: RSI (14)
RSI (14) Daily: 41.62
Daily RSI is sitting below 50 but comfortably above classical oversold territory. That lines up with a controlled downtrend rather than panic selling. Bears still have the upper hand, but they are not driving price into exhaustion yet. For traders, this means there is room for another leg lower if the structure breaks, but also enough fuel for a technical bounce if support continues to hold.
Momentum Confirmation: MACD
MACD line: -0.10
Signal line: -0.12
Histogram: 0.02
The MACD is negative, consistent with the prevailing bearish regime, but the line is slightly above the signal and the histogram has ticked into positive territory. In plain language, the downtrend is still there, but the downside momentum is fading and short-term selling pressure is no longer accelerating. This is often how a market starts transitioning from a straight-down move into either consolidation or a reversal attempt.
However, this is an early sign only. Without price reclaiming key levels, MACD easing off is not enough to declare a trend change.
Volatility & Range: Bollinger Bands and ATR
Bollinger Bands (20,2):
Mid band: 1.48
Upper band: 1.71
Lower band: 1.26
ATR (14) Daily: 0.13
Price is hugging the middle band at 1.48, just under it, rather than riding the lower band. That tells us the recent sell pressure has cooled and price is oscillating around the 20-day average band. The upper band sits near 1.71, right around the 50-day EMA, which reinforces that 1.70–1.71 area as a serious resistance cluster for any upside move.
ATR at 0.13 means the typical daily swing is under 10% of price. For XRP, that is moderate volatility, not a volatility spike associated with capitulation, but also not a dead market. Traders can reasonably expect intraday swings, but nothing like the kind of blow-off ranges that usually mark trend extremes.
Key Daily Reference Levels: Pivots
Pivot point (PP): 1.48
Resistance R1: 1.49
Support S1: 1.46
The daily pivot sits exactly around where price is trading now. Trading slightly below PP and under R1 keeps XRP in a marginally bearish intraday posture on the higher timeframe: sellers are still leaning on rallies toward 1.48–1.49. S1 at 1.46 is the first line of defense; if that breaks with volume, the door opens for a move toward the lower band area, with 1.40–1.35 as a natural extension zone.
Hourly Timeframe (H1) – Short-Term Bias: Neutral / Range-Bound
On the 1-hour chart, XRPUSDT looks more like a market catching its breath than one in free fall.
Trend and Structure: EMAs
H1 close: 1.47
EMA 20: 1.48
EMA 50: 1.48
EMA 200: 1.44
Regime: Neutral
Price is sitting just below the 20 and 50-hour EMAs, but still above the 200-hour EMA. This gives us a very different picture versus the daily chart: in the short term, the longer intraday trend (200 EMA) is still intact, and price is consolidating a bit above it while failing to convincingly reclaim the shorter intraday EMAs.
In simple terms, the hourly structure says: downtrend on the bigger chart, sideways on the intraday. That is consistent with consolidation inside a larger bearish context and often precedes either a continuation drop or a relief bounce.
Momentum and Volatility: RSI, MACD, Bands, ATR
RSI (14) H1: 45.65
MACD H1: line 0, signal 0, histogram 0
Bollinger mid: 1.48 (up 1.49, low 1.46)
ATR (14) H1: 0.01
The hourly RSI below 50 but not oversold confirms a slight bearish tilt without capitulation. MACD at zero with a flat histogram shows a market in balance, where neither buyers nor sellers are strongly in control on this timeframe right now.
Price is trading within a very tight band between roughly 1.46 and 1.49, with an hourly ATR of 0.01. That is a narrow intraday range, pointing to short-term indecision and compression. Range compression in a bearish macro context often resolves with a directional move; the hourly structure will be key to spotting which way that breaks.
Hourly Pivots
H1 Pivot (PP): 1.47
R1: 1.48
S1: 1.46
On the hourly, 1.47 is the immediate battleground. Trading right at the pivot keeps the intraday stance neutral. A sustained push above 1.48 would tilt the very short term in favor of a bounce, while repeated failures at 1.48 followed by a clean move under 1.46 would hand control back to sellers.
15-Minute Timeframe (M15) – Execution Context Only
The 15-minute chart is not for macro decisions here; it just tells us how clean or choppy the execution environment is around these levels.
Short-Term Structure: EMAs and RSI
M15 close: 1.47
EMA 20: 1.48
EMA 50: 1.48
EMA 200: 1.49
RSI (14) M15: 34.92
Regime: Neutral
On M15, price is wedged below all three EMAs, including the 200-period, and RSI is dipping into the mid-30s. That is a short-term intraday bearish skew, meaning local pressure is to the downside even as the hourly chart is neutral. If you are looking at very tight entries or exits, be aware the microstructure currently favors sellers on small timeframes.
Micro Volatility: Bands, ATR, and Pivot
Bollinger mid M15: 1.48 (up 1.50, low 1.47)
ATR (14) M15: 0.01
M15 Pivot: 1.47 (R1 1.47, S1 1.47 – effectively flat)
The 15-minute bands are extremely tight, and the pivot levels are effectively compressed around the same price. This confirms a very short-term squeeze with low realized volatility, where small orders can move price within the micro-range. It is a choppy execution zone better suited to scalpers than position traders.
Putting It Together – Main Scenario and Key Paths
The dominant scenario based on the daily chart is bearish. XRP is in a downtrend under all major daily EMAs, with sentiment in the wider market extremely fearful and BTC dominance high. The lower timeframes do not strongly contradict this: the hourly chart is neutral and compressing, and the 15-minute leans mildly bearish.
Bullish Scenario – Mean Reversion From Support
For bulls, this is a potential mean-reversion setup rather than a trend-following buy.
What needs to happen:
- Daily support at 1.46 holds. Price should defend S1 on both the daily and hourly charts and avoid a clean close below 1.46. Ideally, any dips below are quickly bought back, leaving lower wicks on intraday candles.
- Reclaim of 1.48–1.49 and the daily mid-band. A sustained move and daily close back above the Bollinger mid (1.48) and R1 (1.49) would show buyers are regaining some control. That would likely be accompanied by daily RSI curling back toward 50 and the MACD histogram staying positive or expanding.
- Target zone into the EMA cluster. If those steps occur, the upside mean-reversion target band sits around 1.53–1.71, spanning the 20-day EMA up into the upper band and 50-day EMA convergence. That area is where short-term bulls would likely face strong selling interest again.
What invalidates the bullish case: A decisive break and close below 1.46 on the daily, especially if accompanied by rising ATR and RSI dropping into the low 30s, would argue the bounce has failed and the downtrend is resuming. In that scenario, treating the move as a mean-reversion long becomes low probability.
Bearish Scenario – Trend Continuation After Compression
The more straightforward play with the current structure is a trend-continuation short on weakness in the Ripple crypto price.
What needs to happen:
- Breakdown below 1.46 with follow-through. A clean push under S1 (1.46) on both daily and hourly charts, followed by acceptance (no immediate reclaim), would indicate sellers have won the current range battle.
- Hourly EMAs roll over and price stays below them. On H1, you would want to see price rejected from the 20/50-hour EMAs around 1.48 and start using them as dynamic resistance, aligning intraday structure with the bearish daily trend.
- Momentum re-energizes to the downside. Daily RSI breaking under 40 and heading toward mid-30s, with MACD rolling lower and the histogram flipping back deeper into negative, would confirm that the brief easing in downside momentum is over.
In that case, the next logical technical magnets sit toward the lower Bollinger Band at 1.26, with intermediate psychological levels (1.40, 1.35) along the way. Volatility (ATR) would likely expand in that move as traders exit late longs and fresh shorts pile in.
What invalidates the bearish case: A daily close back above roughly 1.53 (20-day EMA) would be the first clear warning sign. A move above 1.53 that holds, especially if accompanied by an hourly structure flipping bullish, with price above the 200-hour EMA and rising RSI, would imply the market is transitioning from a simple corrective downtrend into a broader base or even a new up-leg.
Positioning, Risk, and Uncertainty
XRPUSDT is in a downtrend with signs of short-term stabilization. The daily chart still says respect the bearish regime, while the lower timeframes show compression rather than capitulation. That combination usually favors patience: forcing trades inside a tight 1.46–1.49 range is mostly noise unless you operate on very short horizons.
For directional positioning, the cleaner plays tend to come after this compression resolves, either via a convincing reclaim of the 1.48–1.53 band for countertrend longs or a clear break and acceptance below 1.46 for trend-following shorts. In both cases, volatility and slippage can increase around the break, so using the ATR numbers as a rough gauge of expected daily swing is sensible risk management.
As always in a market dominated by macro risk-off flows and extreme fear sentiment, headline and cross-asset volatility, especially from Bitcoin, can quickly disrupt these technical structures. Any position around XRP here has to account for the possibility of fast moves and false breaks, particularly while the market trades under all major daily EMAs.
In short, the Ripple crypto price is sitting at an awkward spot, technically weak on the higher timeframe but not yet in panic mode. Traders who respect the higher timeframe downtrend while waiting for cleaner confirmation from the current range will generally be better aligned with how this tape is behaving.
You May Also Like

Trump Mar-a-Lago WLFI Crypto Forum Begins

Revel Digital Launches Comprehensive AI Suite for Digital Signage
